Figures & data
Figure 1. Flow chart of COPD subjects’ identification.
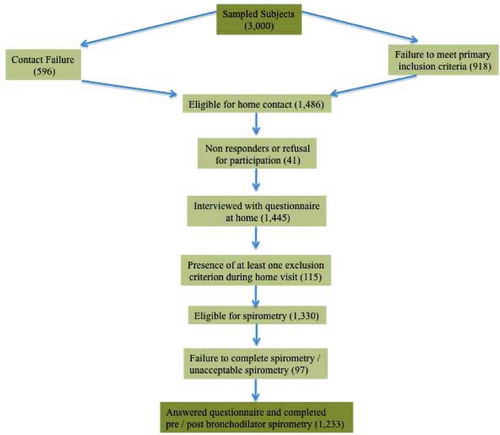
Table 1. Characteristics of the study population (N = 1,233)
Table 2. Mean pack-years by gender, age, community setting and educational level for the study population N = 1,233)
Figure 2. COPD prevalence stratified by age and smoking status according to GOLD severity classification criteria (Citation1). CS, current smokers; ES, ex-smokers.
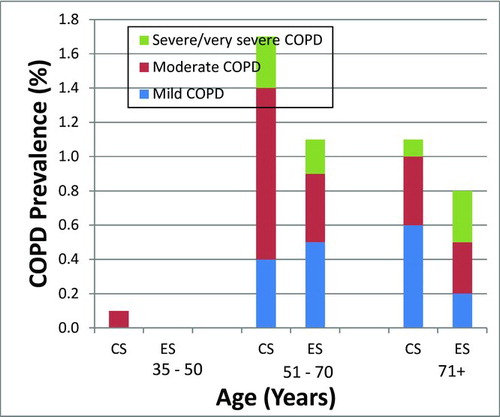
Figure 3. Clinical and physician diagnosis of COPD in spirometry defined COPD subjects. Clinical diagnosis of COPD: affirmative answer to the question: “Do you usually have cough and phlegm most days in periods of at least three months during at least two successive years?” Physician diagnosis of COPD: affirmative answer to the question: “Has a doctor ever told you that you have: a) chronic bronchitis, b) emphysema, c) chronic obstructive pulmonary disease?”
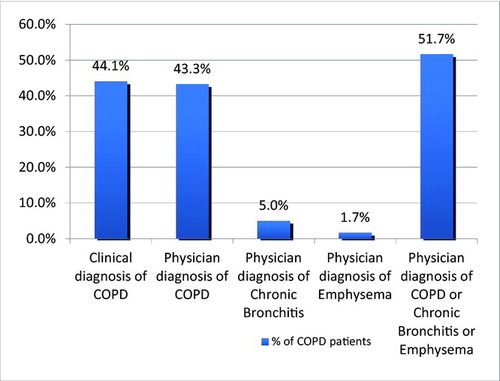
Table 3. Comparison between COPD and non COPD participants
Table 4. Distribution of specific chronic conditions among the study population