Figures & data
Figure 1. Patient disposition and reasons for exclusion. COPD, chronic obstructive pulmonary disease; CT, computed tomography.
Table 1. Baseline characteristics of the study patients (N = 42)
Table 2. Baseline characteristics of the two groups: Patients with and without a history of COPD exacerbations
Figure 2. Annual change in thoracic vertebral BMD in patients without / with a history of exacerbations. -1 Annual absolute change in thoracic vertebral BMD in patients without / with a history of exacerbations (ΔBMD (mg/ml·year): -0.30 versus -3.78, p = 0.01). -2. Annual percentage change in thoracic vertebral BMD in patients without / with a history of exacerbations based on baseline BMD. (ΔBMD/base (mg/ml·year): -0.60 versus -5.41, p = 0.02). The horizontal line is the median value, the box is the interquartile range, and the whiskers indicate the range, excluding outlying and extreme values (i.e., points with values ≥1.5 box lengths from the upper or lower limits of the box). BMD, bone mineral density; ΔBMD, annual change in thoracic BMD; ΔBMD/base, annual percentage change in BMD based on baseline BMD.
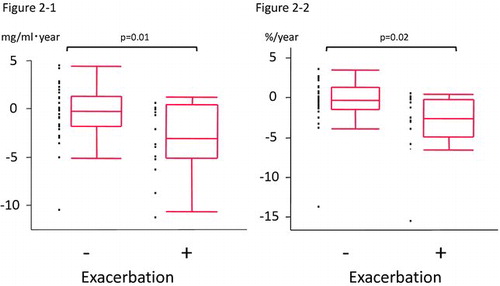
Table 3. Annual changes in thoracic vertebral BMD, lung function, and LAA%
Figure 3. Annual emphysematous change represented as LAA% on CT in patients without / with a history of exacerbations. (LAA (%): 0.12 versus 1.32, p = 0.01) The horizontal line is the median value, the box is the interquartile range, and the whiskers indicate the range, excluding outlying and extreme values (i.e., points with values ≥1.5 box lengths from the upper or lower limits of the box). LAA, low attenuation area; CT, computed tomography.
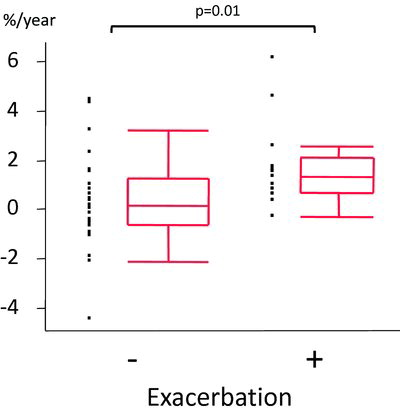
Table 4. Univariate associations with annual change in thoracic vertebral BMD
Table 5. Stepwise multivariate regression analysis showing the relative contribution of each variable to predict the change in BMD