Figures & data
Table 1. Subject characteristics
Figure 1. ROC curve for the final model which included age, smoking status and the CAT breathlessness score. The area under the curve for the model is 0.772.
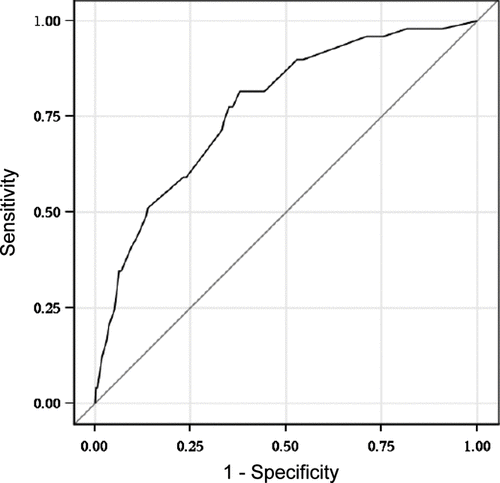
Table 2. Odds ratio estimates for components of the final model that related to COPD
Figure 2. Decision tree based on the final logistic regression model. Where the outcome of the model had a low probability of COPD, we recommend no further screening. Where the model determines an increased probability of COPD, we recommend going on to confirmatory testing with spirometry.
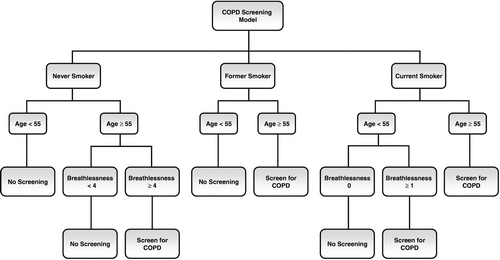
Table 3. Diagnosis of COPD based on components of the final model and a logistic probability of 0.097