Figures & data
Table 1. Demographics of workshop subjects
Table 2. Number of scans and readings in each group.
Table 3. Kappa values for presence or absence of specific variables
Table 4. Percentage of readings on which CT findings were identified, by disease category
Table 5(a). Concordance between quantitative CT percentages of emphysema and visual evidence of emphysema
Table 5(b). Concordance between quantitative CT and visual evidence of gas trapping on expiratory CT
Table 5(c). Concordance between quantitative CT and visual evidence of airway wall thickening
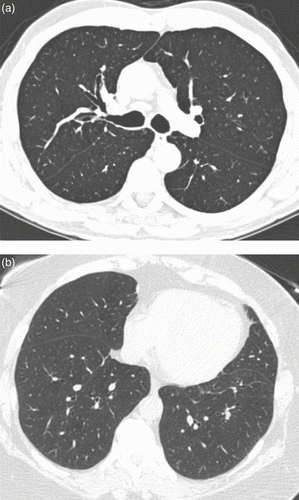
Figure 1. (a) Axial CT image in a subject with GOLD Stage 1 COPD, where reviewers scored visual emphysema, but quantitative% of emphysema was less than 1%. CT shows mild centrilobular emphysema, which did not reach the quantitative threshold for emphysema. (b) Axial CT image in a subject with GOLD Stage 1 COPD where reviewers scored no visual emphysema, but quantitative% of emphysema was 18%. Close inspection shows multiple small foci of decreased attenuation adjacent to vessels which may either represent dilated peripheral airways or very early emphysema.
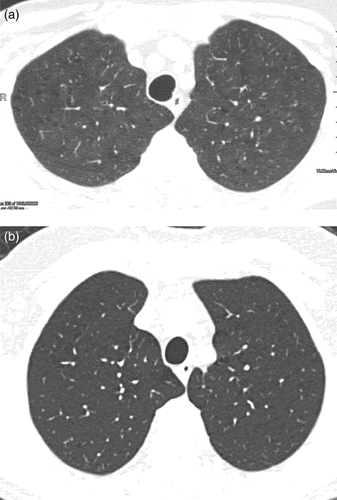
Figure 2. Axial CT image in a non-smoking, physiologically normal subject, where reviewers scored visual gas trapping, but quantitative% of gas trapping was only 11%. CT shows relatively mild multilobular gas trapping, which did not reach the quantitative threshold for gas trapping.
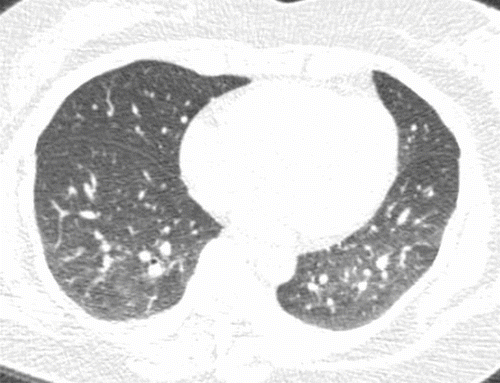
Figure 3 (a) Axial CT image in a subject with GOLD Stage 1 COPD, where reviewers scored visual bronchial wall thickening, but wall area% of segmental bronchi was 55%. CT shows evidence of thickening of the bronchial walls, but associated moderate dilation of the bronchial lumens resulted in normalization of the wall area% value. (b) Axial CT image in a smoking control subject where reviewers scored no bronchial wall thickening, but wall area% of segmental bronchi was 63%. Although the bronchial walls appear visually normal, the bronchial lumens are relatively small, and this might have resulted in artificial elevation of the wall area% value.