Figures & data
Table 1. Clinicophysiological parameters of the subjects
Figure 1. Cholesterol (Chol) and Phospholipid (PL) contents of erythrocyte membrane (expressed as μg/mg proteins) H = Healthy non-smokers, S = Healthy smokers, Group I = patients of COPD stage II, Group II = Patients of COPD stage III, Group III = Patients of COPD stage IV. N = 10 in each group. Data represented as mean ± S.E.M.
Figure 2. Correlation between FEV1% and total cholesterol of erythrocyte membrane. The cholesterol is expressed as μg/mg membrane proteins.
Figure 3. Correlation between FEV1% and total phospholipid (PL) of erythrocyte membrane of all stages of COPD combined. The PL is expressed as μg/mg membrane proteins.
Figure 4. Phosphatidylethanolamine (PE) and phosphatidylcholine (PC) contents of the erythrocyte membrane (expressed as μg/mg proteins). H = Healthy non-smokers, S = Healthy smokers, Group I = Patients of COPD stage II, Group II = Patients of COPD stage III, Group III = Patients of COPD stage IV. N = 10 in each group. Data represented as mean ± S.E.M.
Figure 5. Chromatogram of fatty acid analysis of phosphatidylcholine (PC) as representative of the phospholipids of erythrocyte membrane in various groups of patients having COPD (Group I-III), healthy smokers (S) and healthy non-smokers (H). H = Healthy non-smokers, S = Healthy smokers, Group I = Patients of COPD stage II, Group II = Patients of COPD stage III, Group III = Patients of COPD stage IV.
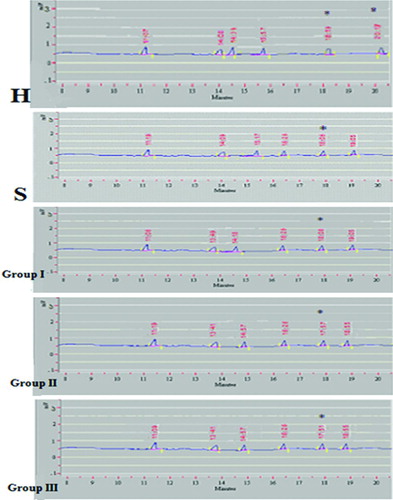
Table 2. Fatty acid composition of erythrocyte membrane of acidic phospholipids (Phoshatidylinositide, Phosphatidylserine)
Table 3. Fatty acid composition of erythrocyte membrane neutral phospholipids (Phoshatidylcholine, Phoshatidylethanolamine)
Table 4. Fatty acid composition of erythrocyte membrane sphingomyelin (Sph)
Table 5. Lipid ratios in erythrocyte membranes