Figures & data
Figure 1. Neutrophilic infiltration in the lung of guinea pigs. Individual counts for neutrophils in the airways (A), pulmonary vessels (B) and alveolar septa (C) of controls and CS-exposed animals. Results are expressed as number of cells normalized by Pil in airways, Pim in vessels or square millimeter in alveolar septa. Horizontal bars represent median values. * p ≤ 0.05 CS-exposed vs. Control (Mann-Whitney rank sum test). Photomicrographs of an airway (D), a pulmonary vessel (E) and alveolar septa (F) of guinea pigs exposed to CS (H&E stain. Scale bar, 20 mm). Arrows show infiltrating neutrophils.
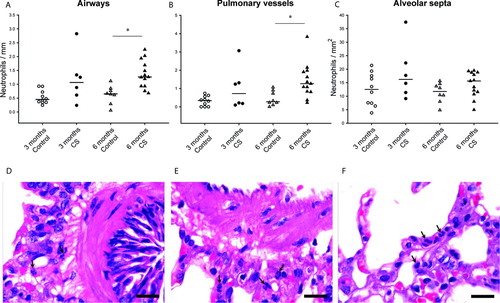
Table 1. Number of neutrophils, macrophages and eosinophils in lung structures after different periods of cigarette smoke exposure
Figure 2. Macrophage infiltration in the lungs of guinea pigs. Individual count for macrophages in the airways (A), pulmonary vessels (B) and alveolar septa (C) of controls and CS-exposed animals. Results are expressed as number of cells normalized by Pil in airways, Pim in vessels or square millimeter in alveolar septa. Horizontal bars represent median values. * p ≤ 0.05 CS-exposed vs. Control (Mann-Whitney rank sum test). Photomicrographs of an airway (D), a pulmonary vessel (E) and alveolar septa (F) of guinea pigs exposed to CS (PAS stain. Scale bar, 20 mm). Arrows show infiltrating macrophages.
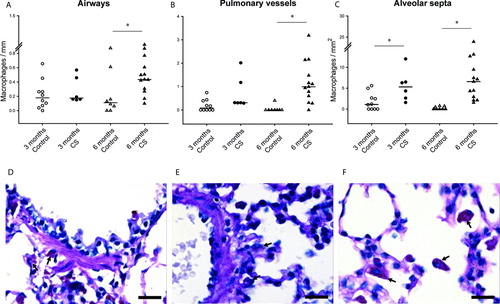
Figure 3. Eosinophil infiltration in the lungs of guinea pigs. Individual count for eosinophils in the airways (A), pulmonary vessels (B) and alveolar septa (C) of controls and CS-exposed animals. Results are expressed as number of cells normalized by Pil in airways, Pim in vessels or square millimeter in alveolar septa. Horizontal bars represent median values. * p ≤ 0.05 CS-exposed vs. Control (Mann-Whitney rank sum test). Photomicrographs of an airway (D), a pulmonary vessel (E) and alveolar septa (F) of guinea pigs exposed to CS (Congo red stain. Scale bar, 20 mm). Arrows show infiltrating eosinophils.
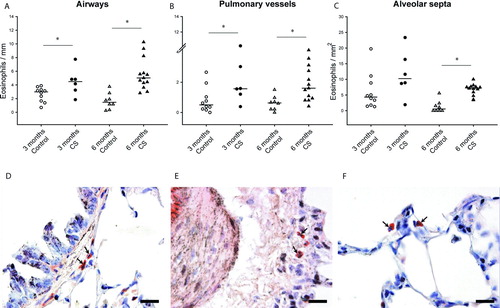
Figure 4. Pulmonary lymphoid follicles. Percentage of individuals with presence or absence of lymphoid follicles in lung tissue of control and CS-exposed groups (A).* p < 0.05 (Fisher exact test). Photomicrographs of lymphoid follicle (arrows) in peribronchial (B) and perivascular (C) lung tissue of CS-exposed guinea pigs at 6 months (H&E stain. Scale bar, 100 mm).
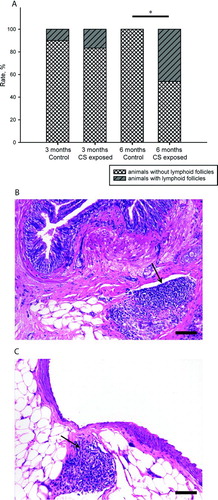
Figure 5. Morphometry of airways. Bar graphs show mean ± SEM of airway wall thickness, in all (A), larger (B) and smaller (C) airways in both control and CS-exposed guinea pigs, for 3 and 6 months of exposure. Immunohistochemistry for SMC a-actin in airways of a control (D) and a CS-exposed (E) animal. Scale bar, 100 mm. * p ≤ 0.05 CS-exposed vs. Control, ‡ p£0.05 6 months Control vs. 3 months Control and † p ≤ 0.05 6 months CS-exposed vs. 3 months CS-exposed (t-test).
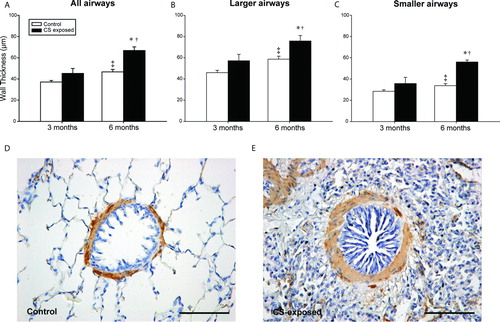
Table 2. Morphological characteristics of airways
Table 3. Morphological characteristics of vessels
Figure 6. Collagen deposition in the lungs. Bar graphs show mean ± SEM of the percentage of area occupied by total collagen and thick and thin collagen fibres in the alveolar septa of control and CS-exposed guinea pigs (A). Photomicrographs of lung sections stained with Sirius red. Total collagen fibers were seen in red under bright field (B and D) and orange to red (thick collagen fibres) or green (thin collagen fibres) under polarized light (C and E). Scale bars, 100 mm. * p ≤ 0.05 CS-exposed vs. Control and † p ≤ 0.05 6 months CS-exposed vs. 3 months CS-exposed (Mann-Whitney rank sum test).
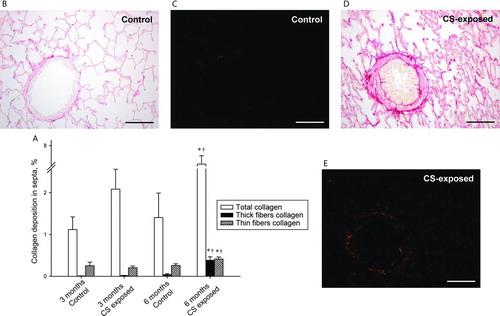
Table 4. Collagen deposition in airways
Figure 7. Correlations between inflammatory infiltrate and remodelling. Linear regression of neutrophils (A) and macrophages (B) with the thickness of total wall in smaller airways. Solid circles are CS-exposed animals independently of time of exposure.
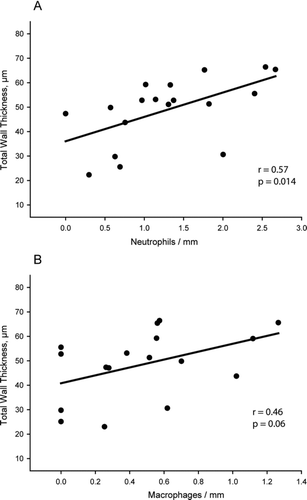
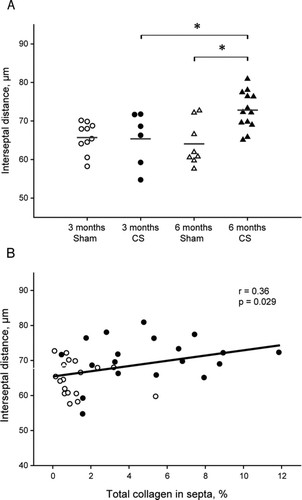
Figure 8. Emphysema in the lungs and correlation with fibrosis. Dot plot showing individual interseptal distance in each experimental group and mean (horizontal bars) (A). *p ≤ 0.05 (t-test). Linear regression of total collagen in septa with the mean linear intercept of alveolar septa (B). Solid circles are CS-exposed animals and open circles are sham-exposed animals independently of time of exposure.
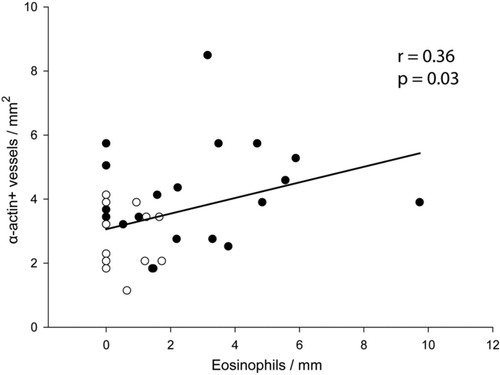
Supplementary Figure 9. Correlation between eosinophils and muscularization. Linear regression of perivascular eosinophils with the number of vessels per mm2 positive to a-actin in lung tissue. Solid circles are CS-exposed animals and open circles are sham-exposed animals independently of time of exposure.