Figures & data
Figure 1. A flow chart shows the results of the literature search and selection for this systematic review.

Table 1. Characteristics of included studies
Table 2. The number of true positives, false positives, false negatives and true negatives were calculated according to each sensitivity and specificity by Review Manager 5.1
Table 3. QUADAS-2 results for studies performed with CT
Figure 2. Bivariate summary estimates of sensitivity and specificity for all of the studies and the corresponding 95% confidence ellipse around these mean values.
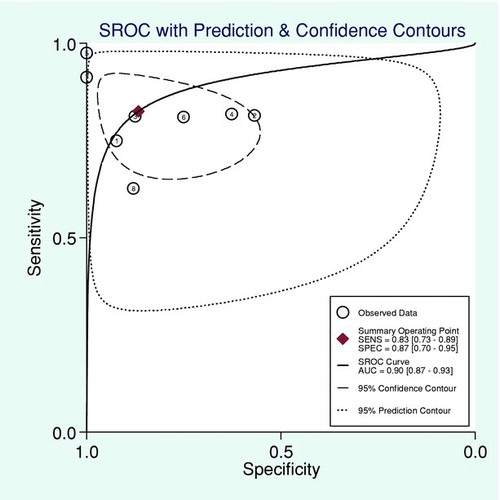
Table 4. Summary estimates for sensitivity, specificity, and diagnostic odds ratio for all studies from the bivariate model
Table 5. Summary estimates for sensitivity, specificity, and diagnostic odds ratio for different text index from the bivariate model
Table 6. Summary estimates for accuracy measures for types of imaging technique from the sROC approach
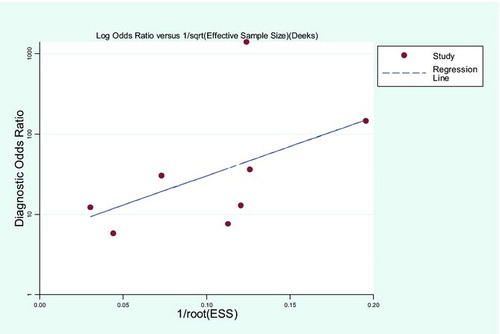
Figure 3. Funnel plot for evaluation of publication bias in all studies.