Figures & data
Table 1. Characteristics of male and female sustained quitters and continuing smokers.
Table 2a. Post-bronchodilator FEV1 over year 1 through year 5; results of mixed model analysis (males).
Table 2b. Post-bronchodilator FEV1 over year 1 through year 5; results of mixed model analysis (females).
Figure 1. Predicted FEV1 (± SEM) from the mixed model at Year 1 to Year 5 in male sustained quitters stratified by the DRD2 A1+ or the DRD2 A1- allele (A), the DAT 9R+ or the DAT 9R- allele (B) and the combination of both the DRD2 A1- and DAT 9R+ or neither the DRD2 A1- nor the DAT 9R+ allele (C).
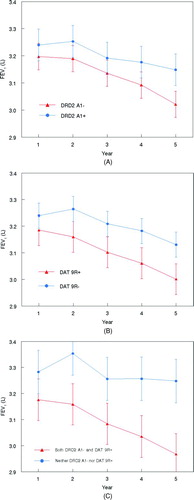
Table 3. Mean slopes (± SEM) of change in FEV1% predicted per year from Year 1 through Year 5 by DRD2 and DAT alleles and combinations thereof, gender and smoking status.
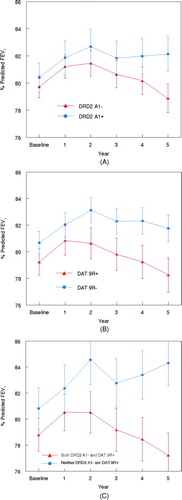
Figure 2. Observed percent predicted FEV1 (± SEM) at baseline and Year 1 to Year 5 in male sustained quitters stratified by the DRD2 A1+ or the DRD2 A1- allele (A), the DAT 9R+ or the DAT 9R- allele (B) and the combination of both the DRD2 A1- and DAT 9R+ or neither the DRD2 A1- nor the DAT 9R+ allele (C).