Figures & data
Figure 1. Flow chart of study population. *Subjects denying participation in 2007. **Subjects not able to attend to the yearly examination in 2007.
Table 1. Basic characteristics of the study population (n = 1350), p value for comparing COPD vs. non-COPD
Table 2. FACIT-F scores in non-COPD, COPD and COPD with respiratory symptoms, by disease severity
Figure 2. Box plots showing median and quartiles of FACIT-F score with a line depicting the clinical significant fatigue based on Minimally Important Difference, MID (defined as minus 3 units difference in median score from non-COPD). Non-COPD, COPD with respiratory symptoms (COPD-rs) stage I, II and III-IV.
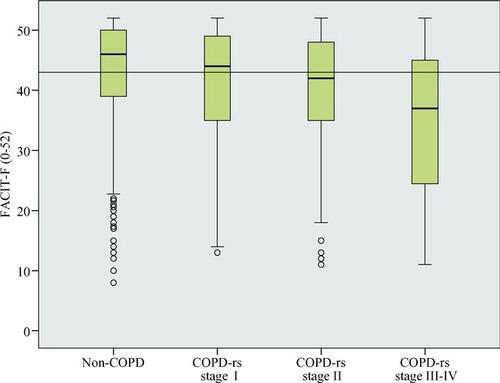
Figure 3. Median FACIT-F score in subjects without heart disease and with heart disease in the groups non-COPD, COPD and COPD stage I, II and III-IV. *Comparing subjects without heart disease and subject with heart disease.
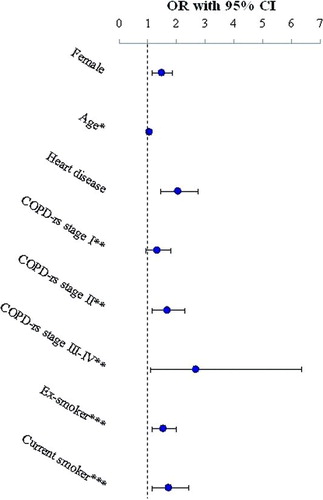
Figure 4. Multiple logistic regression analysis of risk factors for clinically significant fatigue, Minimally Important Difference, MID (defined as minus 3 units difference in median score from non-COPD) including the co-variates gender, age, COPD with respiratory symptoms (COPD-rs) by stage, heart disease and smoking habits, presented as odds ratio (OR) and 95% confidence intervals (CI). *Entered like a continuous variable (age OR 1.02, CI 1.01-1.03). **Reference = non-COPD. ***Reference = non-smoker.