Figures & data
Figure 1. A schemata of the pulse device used in the study. A: Constant airflow inlet; B: Oscillating airflow outlet into patient's mouth.
Figure 2. Screening, randomization, and follow up.
Figure 3. Flow chart of the study.
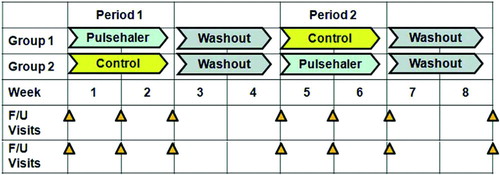
Table 1. Baseline characteristics of patients
Table 2. Medical events during the trial
Figure 4. Percentage of patients responding (responders) to treatment with the oscillatory device. Percentage of patients with a clinically significant improvement (responders) following treatment with the oscillatory device. The following improvements were defined as clinically significant: >40 m in 6MW; >12% in FVC; >12% in FEV1; <0.05 in RV/TLC (abs); >1 in dyspnea score; >1 in mastery score.
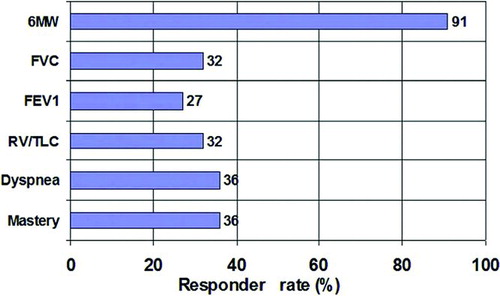
Figure 5. Changes in the 6-minute walk (6MW) test. Maximal change in the 6MW test compared to baseline for each patient with the sham device (left) and the oscillatory device (right).
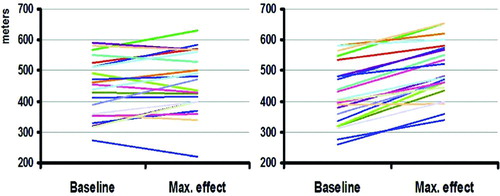
Table 3. Changes induced by oscillatory and control device treatments measured 1 and 2 weeks after the beginning of each round of treatment