Figures & data
Figure 1. Large airway of an asthmatic patient stained with Movatエs pentachrome. With this staining, cartilage and mucous cells stain in blue, muscle in red, elastin in black/purple and connective tissue in yellow. The analyzed airway compartments were: inner wall (iw), airway smooth muscle (asm), submucosal glands area (sm) and outer wall (ow). Basement membrane = bm. Cartilage = c. Scale bar = 250 μm.
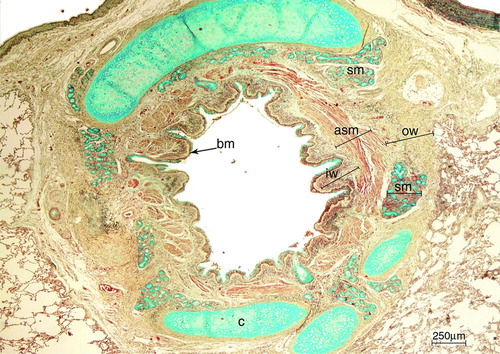
Table 1. Clinical characteristics of asthma and COPD patients
Figure 2. Histological examples of large and small airways of patients with asthma (A, B), with COPD (C, D) and a control patient (E, F). Observe the prominent airway smooth muscle layer (asm) in large and small airways of the asthmatic patient. Cartilage = c, airway smooth muscle = asm, submucosal gland = sm, ep = epithelium. H&E staining. Scale bar = 250 μm in A, C and E. Scale bar = 100 μm in B, D and F.
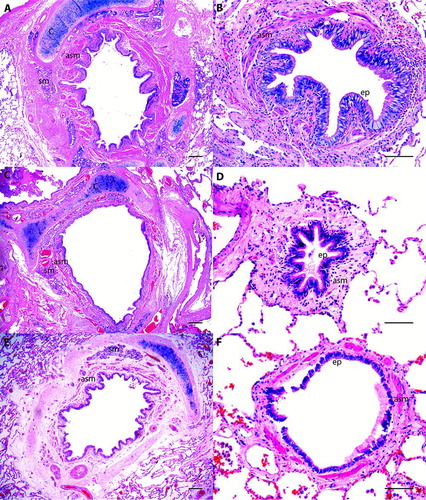
Table 2. Characteristics of control patients
Table 3. Airway dimensions in fatal asthma, severe fatal COPD and controls
Figure 3. Longitudinal sections of a large airway of patients with asthma (A), COPD (B) and a control patient (C). The basement membrane (bm) in A is thicker than in B and C, and has an hyaline eosinophilic aspect. Observe the thick airway smooth muscle (asm) bundle in A. Submucosal gland = sm, cartilage = c. H&E staining. Scale bar = 50 μm.
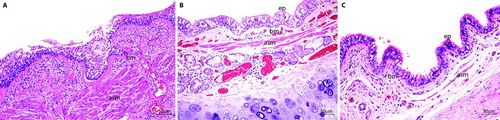
Figure 4. Large airways basement membrane thickness (μm) in younger adult fatal asthmatics (YFA), older adult fatal asthmatics (OFA) and in patients with severe Chronic Obstructive Pulmonary Disease (COPD). Data presented as mean ± SEM.
Figure 5. Large airway dimensions in younger adult fatal asthmatics (YFA), older adult fatal asthmatics (OFA) and in patients with severe Chronic Obstructive Pulmonary Disease (COPD). Areas were normalized by basement membrane perimeter (μm2/μm). Each bar indicates the median and the whiskers represent the interquartile range. IW = inner wall, ASM = airway smooth muscle, OW = outer wall, gland = submucosal glands area.
Figure 6. Small airway dimensions in younger adult fatal asthmatics (YFA), older adult fatal asthmatics (OFA) and in patients with severe Chronic Obstructive Pulmonary Disease (COPD). Areas were normalized by basement membrane perimeter (μm2/μm). Each bar indicates the median and the whiskers represent the interquartile range. IW = inner wall, ASM = airway smooth muscle, OW = outer wall.
Figure 7. Curve estimation plots of parameters associated with age in regression analyses. Fit lines represent quadratic curves. ASM, airway smooth muscle; COPD, chronic obstructive pulmonary disease; OCTRL, older controls; OFA, older fatal asthma; YCTRL, younger controls; YFA, younger fatal asthma. Age presented in years, basement membrane thickness presented in μm, ASM and outer wall areas presented in μm2/μm.
Figure 8. Large airways inflammation in the inner wall (IW) and outer wall (OW) in younger adult fatal asthmatics (YFA), older adult fatal asthmatics (OFA), patients with severe Chronic Obstructive Pulmonary Disease (COPD), younger controls (YCTRL) and older controls (OCTRL) based on a semi-quantitative score (0 = no inflammation, 1 = mild inflammation, 2 = moderate inflammation, 3 = intense inflammation). Data presented as median/IQR. *p ≤ 0.01 vs. COPD. †p < 0.001 vs. YCTRL and OCTRL. §p < 0.01 vs. YCTRL and OCTRL.
Figure 9. Small airways inflammation in the inner wall (IW) and outer wall (OW) in younger adult fatal asthmatics (YFA), older adult fatal asthmatics (OFA), patients with severe Chronic Obstructive Pulmonary Disease (COPD), younger controls (YCTRL) and older controls (OCTRL) based on a semi-quantitative score (0 = no inflammation, 1 = mild inflammation, 2 = moderate inflammation, 3 = intense inflammation). Data presented as median/IQR. *p ≤ 0.001 vs. YCTRL. †p = 0.002 vs. OCTRL. §p ≤ 0.001 vs. OCTRL. ‡p < 0.001 vs. COPD. **p = 0.04 vs. COPD. §§p = 0.004 vs.OCTRL.