Figures & data
Table 1. Descriptive characteristics of the COPD and healthy populations
Table 2. Functional characteristics of the entire COPD study population
Figure 1. Scatter plot of percentage expiratory tracheal collapse as a function of BMI shows considerable variability.
Figure 2. Stem-and-leaf plots of percentage expiratory tracheal collapse in COPD patients by BMI category.
Table 3. Functional, symptom and treatment indices by BMI category in COPD study population
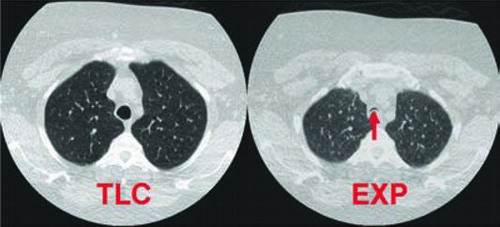
Figure 3. Dynamic expiratory tracheal collapse in a 51-year-old, morbidly obese woman with COPD. Paired axial CT images 1 cm above aortic arch obtained at total lung capacity (TLC) and during forced expiration (EXP) demonstrate near complete dynamic expiratory tracheal collapse (arrow), with 93% expiratory reduction in tracheal luminal cross-sectional area. Image is displayed using large field of view in order to also illustrate obese body habitus.