Figures & data
Table 1. Clinical characteristics of COPD patients and controls
Table 2. Quadriceps muscle fiber cross-sectional areas in COPD patients and controls
Figure 1. Box plots of atrogin-1 and MuRF-1 protein levels in COPD patients with and without a low FFMI and healthy age-matched controls. Atrogin-1 protein levels in quadriceps muscle were lower in COPD patients than controls [0.64(0.31,1.24)AU vs 1.41(0.68,2.06)AU, p = 0.03, A] but not significantly different in COPD patients with a reduced FFMI compared to patients with a normal [0.73(0.34,1.61)AU vs 0.74(0.12,1.34)AU, p = 0.46, A]. There was a subset of COPD patients with relatively high protein levels of these mediators compared to the controls but these patients were not confined to the low FFMI group. MuRF-1 protein levels were not significantly different in quadriceps muscle from COPD patients compared to controls [0.56(0.45,1.30)AU vs 0.92(0.74,1.50)AU, p = 0.12, B], nor between COPD patients with and without a low FFMI [0.55(0.42,0.92)AU vs 0.59(0.54,1.62)AU, p = 0.35, B].
![Figure 1. Box plots of atrogin-1 and MuRF-1 protein levels in COPD patients with and without a low FFMI and healthy age-matched controls. Atrogin-1 protein levels in quadriceps muscle were lower in COPD patients than controls [0.64(0.31,1.24)AU vs 1.41(0.68,2.06)AU, p = 0.03, A] but not significantly different in COPD patients with a reduced FFMI compared to patients with a normal [0.73(0.34,1.61)AU vs 0.74(0.12,1.34)AU, p = 0.46, A]. There was a subset of COPD patients with relatively high protein levels of these mediators compared to the controls but these patients were not confined to the low FFMI group. MuRF-1 protein levels were not significantly different in quadriceps muscle from COPD patients compared to controls [0.56(0.45,1.30)AU vs 0.92(0.74,1.50)AU, p = 0.12, B], nor between COPD patients with and without a low FFMI [0.55(0.42,0.92)AU vs 0.59(0.54,1.62)AU, p = 0.35, B].](/cms/asset/9ccb3aff-4d82-43ae-b499-6f0706a94c2c/icop_a_781577_f0001_b.gif)
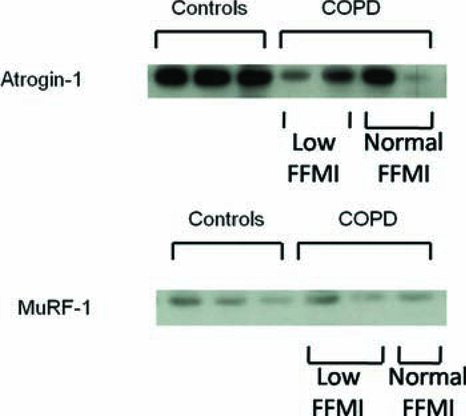
Figure 2. Representative images of western blots for atrogin-1 and MuRF-1 protein in COPD patients and controls. The atrogin-1 band and MuRF-1 bands were seen on separate blots just below the 50 kDA marker. The atrogin bands are denser in the control samples than the COPD samples, with considerable variability between patients, while the MuRF-1 bands show no consistent density difference between COPD samples and controls.