Figures & data
Table 1. Distribution of variables at baseline stratified by calprotectin
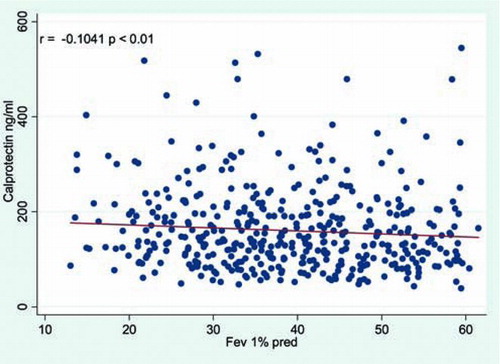
Figure 1. Survival according to the level of calprotectin. Result of the log rank test is displayed in the lower left corner.
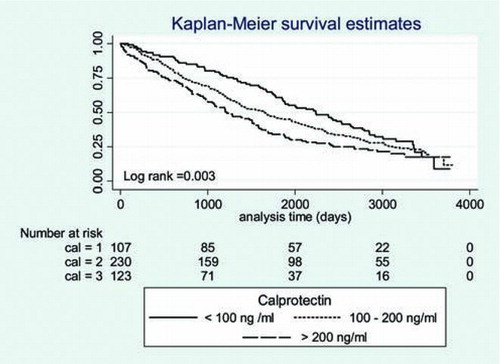
Figure 2. Survival according to the level of calprotectin stratified on tertiles. Result of the log Rank test for trend is displayed bottom left corner.
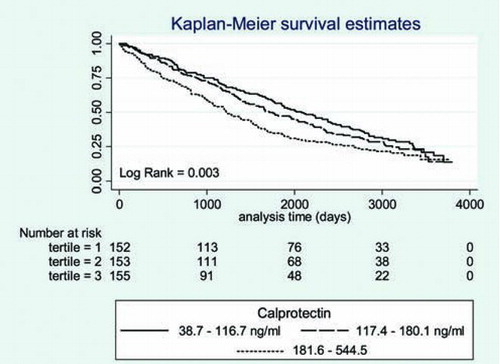
Table 2. Multivariate regression analysis of potential confounders –A multivariate Cox regression was performed to the time period before 1700 days
Figure 3. Scatterplot showing p-calprotectin against FEV 1% predicted. Spearman correlation coefficient and the calculated p-value are displayed upper left corner.