Figures & data
Table 1. Clinical characteristics of the study subjects
Figure 1. Photographs of two-dimensional electrophoresis (2-DE) separation of plasma obtained from eight normal controls and stable and exacerbation state of eight COPD subjects. The plasma proteins (1 mg) were focused on a pH 4–10 gradient strip and then separated on an 7.5–20% gradient sodium dodecyl sulfate-polyacrylamide gel electrophoresis, stained, and visualized as described in the Methods section. Protein spots identified by MALDI-TOF (arrows) are marked by their spot numbers.
![Figure 1. Photographs of two-dimensional electrophoresis (2-DE) separation of plasma obtained from eight normal controls and stable and exacerbation state of eight COPD subjects. The plasma proteins (1 mg) were focused on a pH 4–10 gradient strip and then separated on an 7.5–20% gradient sodium dodecyl sulfate-polyacrylamide gel electrophoresis, stained, and visualized as described in the Methods section. Protein spots identified by MALDI-TOF (arrows) are marked by their spot numbers.](/cms/asset/c216c99e-7e78-42a9-9033-973d3bd73c35/icop_a_828028_f0001_b.gif)
Table 2. List of differentially expressed proteins identified by MALDI-TOF
Figure 2. Changes of retinoic acid receptor alpha level in plasma from stable to exacerbation state of the patients with COPD (n = 15).
![Figure 2. Changes of retinoic acid receptor alpha level in plasma from stable to exacerbation state of the patients with COPD (n = 15).](/cms/asset/9171ca9c-5e75-4de7-8758-8d5d8e78e2fd/icop_a_828028_f0002_b.gif)
Figure 3. Plasma retinoic acid receptor alpha level in nomal controls and stable state of the patients with COPD. (COPD: represents no exacerbation, COPD2a: represents the exacerbation frequency of less than 0.4/year, COPD2b: represents the exacerbation frequency of more than 0.4/year).
![Figure 3. Plasma retinoic acid receptor alpha level in nomal controls and stable state of the patients with COPD. (COPD: represents no exacerbation, COPD2a: represents the exacerbation frequency of less than 0.4/year, COPD2b: represents the exacerbation frequency of more than 0.4/year).](/cms/asset/131273a9-dab0-4101-bb32-0c0b1827e279/icop_a_828028_f0003_b.gif)
Figure 4. Receiver operating curve (ROC) analysis of RAR alpha protein levels as a predictor of exacerbation in COPD. A cut-off of 0.154 ng/ml RAR-α predicted hospital admission with a sensitivity of 71.4% and a specificity of 92.8% (area under the curve of 0.844).
![Figure 4. Receiver operating curve (ROC) analysis of RAR alpha protein levels as a predictor of exacerbation in COPD. A cut-off of 0.154 ng/ml RAR-α predicted hospital admission with a sensitivity of 71.4% and a specificity of 92.8% (area under the curve of 0.844).](/cms/asset/538292b1-fad0-4583-a4fa-3357c957662a/icop_a_828028_f0004_b.jpg)
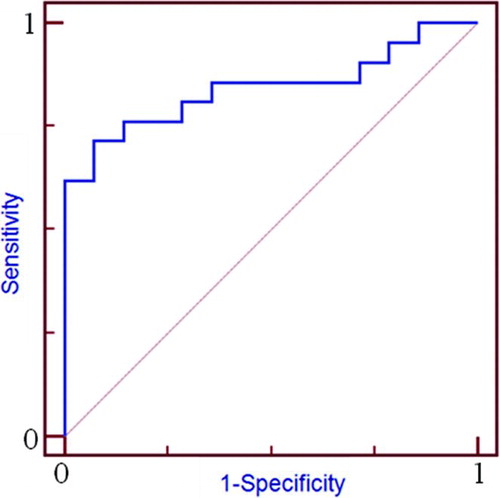
Table s1. Supplementary Analysis of Each spot protein according to score