724
Views
36
CrossRef citations to date
0
Altmetric
ORIGINAL RESEARCH

Analysis of the Plasma Proteome in COPD: Novel Low Abundance Proteins Reflect the Severity of Lung Remodeling

, , , , , , , & show all

Figures & data

Table 1.  Study population (Mean ± 1 SE)

Table 2.  Differentially expressed proteins in COPD determined by GeLC-MS/MS

Figure 1.  Group mean ± SE data showing levels of GRP78, IL1AP, CD163 and MSTP9 in the 80 subject validation group as assessed by immunoassay. Panel A: GRP78 was significantly different across the 3 groups (p < 0.01 by ANOVA) and both GOLD 2 (p < 0.05) and GOLD 3-4 (p < 0.01) were significantly different than control by post-hoc testing. Panel B: sCD163 was significantly different across the 3 groups (p < 0.01 by ANOVA and GOLD 2 (p < 0.01) and GOLD 3-4 (p < 0.01) were both significantly different than control. Panel C: IL1AP was significantly different across the 3 groups (p < 0.01 by ANOVA) and both GOLD 2 (p < 0.01) and GOLD3-4 (p < 0.05) were significantly different than control. Moreover, GOLD2 differed from GOLD 3-4 (p < 0.01). Panel D: MSTP9 was significantly different across the 3 groups (p < 0.01 by ANOVA) and both GOLD 2 (p < 0.01) and GOLD 3-4 (p < 0.05) were significantly different thn control. Symbols indicate **p < 0.01 for comparison of GOLD 3-4 with control; *p < 0.05 for comparison with control; and &&p < 0.01 for comparison with GOLD 2.

Figure 1.  Group mean ± SE data showing levels of GRP78, IL1AP, CD163 and MSTP9 in the 80 subject validation group as assessed by immunoassay. Panel A: GRP78 was significantly different across the 3 groups (p < 0.01 by ANOVA) and both GOLD 2 (p < 0.05) and GOLD 3-4 (p < 0.01) were significantly different than control by post-hoc testing. Panel B: sCD163 was significantly different across the 3 groups (p < 0.01 by ANOVA and GOLD 2 (p < 0.01) and GOLD 3-4 (p < 0.01) were both significantly different than control. Panel C: IL1AP was significantly different across the 3 groups (p < 0.01 by ANOVA) and both GOLD 2 (p < 0.01) and GOLD3-4 (p < 0.05) were significantly different than control. Moreover, GOLD2 differed from GOLD 3-4 (p < 0.01). Panel D: MSTP9 was significantly different across the 3 groups (p < 0.01 by ANOVA) and both GOLD 2 (p < 0.01) and GOLD 3-4 (p < 0.05) were significantly different thn control. Symbols indicate **p < 0.01 for comparison of GOLD 3-4 with control; *p < 0.05 for comparison with control; and &&p < 0.01 for comparison with GOLD 2.

Figure 2.  Receiver operating curves (ROCs) for GRP78, sCD163, IL1AP and MSTP9 for separation of COPD i.e., GOLD 2, 3–4 vs controls in all 80 subjects in the validation group. ROCs were computed for each individual protein and separately for the combination of all 4 proteins. The blue area in each ROC demarcates the upper and lower 95% confidence intervals around the mean (solid line). ROC curves for GRP78, IL1AP and MSTP9 were obtained from the ROCR library in R (reference) by providing it with disease category (1, 0) and marker value for each subject in ng/ml. Since sCD163 is negatively correlated with disease category, its values were negated prior to submission to the R procedure i.e., high values became large negative values. For the 4 markers in combination, values were submitted to logistic regression (R, glm procedure). The resulting log odds of disease as determined by the ROCR procedure was: Log(p/1-p) = 14.56 GRP78 − 0.0013 sCD163 + 3.46 IL1AP − 12.68 MSTP9 = y.

Figure 2.  Receiver operating curves (ROCs) for GRP78, sCD163, IL1AP and MSTP9 for separation of COPD i.e., GOLD 2, 3–4 vs controls in all 80 subjects in the validation group. ROCs were computed for each individual protein and separately for the combination of all 4 proteins. The blue area in each ROC demarcates the upper and lower 95% confidence intervals around the mean (solid line). ROC curves for GRP78, IL1AP and MSTP9 were obtained from the ROCR library in R (reference) by providing it with disease category (1, 0) and marker value for each subject in ng/ml. Since sCD163 is negatively correlated with disease category, its values were negated prior to submission to the R procedure i.e., high values became large negative values. For the 4 markers in combination, values were submitted to logistic regression (R, glm procedure). The resulting log odds of disease as determined by the ROCR procedure was: Log(p/1-p) = 14.56 GRP78 − 0.0013 sCD163 + 3.46 IL1AP − 12.68 MSTP9 = y.

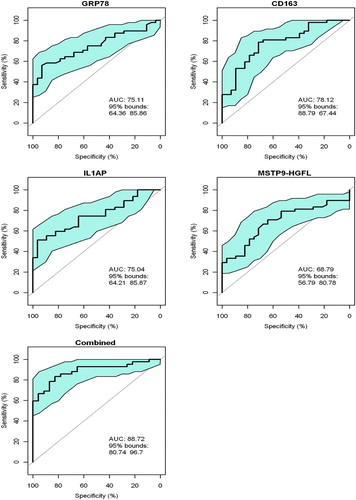
Table 3.  Correlation coefficients for relationship of individual plasma biomarkers with FEV1 or emphysema

Figure S1. Individual 1D SDS PAGE gel of 10 COPD (rows #1 to #10) and 10 control subjects (rows #11 to #20) who comprise the discovery group. Gels show plasma samples in each subject prior to pooling.

Figure S1. Individual 1D SDS PAGE gel of 10 COPD (rows #1 to #10) and 10 control subjects (rows #11 to #20) who comprise the discovery group. Gels show plasma samples in each subject prior to pooling.

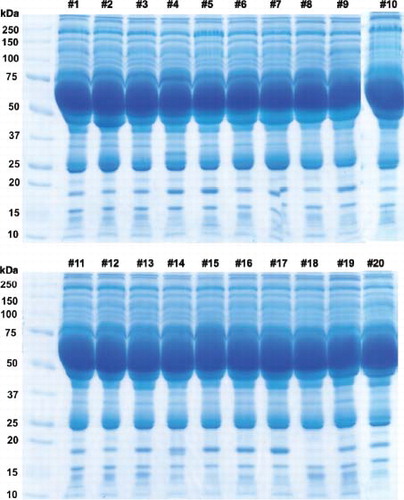
Table S1  Supplementary .

Table S2.  Supplementary Proteins differentially expressed in COPD

Reprints and Corporate Permissions

Please note: Selecting permissions does not provide access to the full text of the article, please see our help page How do I view content?

To request a reprint or corporate permissions for this article, please click on the relevant link below:

Academic Permissions

Please note: Selecting permissions does not provide access to the full text of the article, please see our help page How do I view content?

Obtain permissions instantly via Rightslink by clicking on the button below:

If you are unable to obtain permissions via Rightslink, please complete and submit this Permissions form. For more information, please visit our Permissions help page.