
Figures & data
Diagram 1. CTOORA: (Citation1) Clinical characteristics simulated from a COPD population, with dependencies between exacerbation history and disease progression, (Citation2) Two patient molecular types are simulated given assumed prevalence, (Citation3) Simulated patients are registered according to a mock protocol, and randomized to treatment arms, (Citation4) Biomarker (panel) Dx test is performed, to predict patient molecular type (Citation2), (Citation5) Simulated targeted treatment effect differential by patient molecular type (Citation2), (Citation6) Simulated clinical outcomes given patient histories, treatment, and molecular-type. (Citation7) Biomarker segmentation (assay) merged to clinical outcomes.
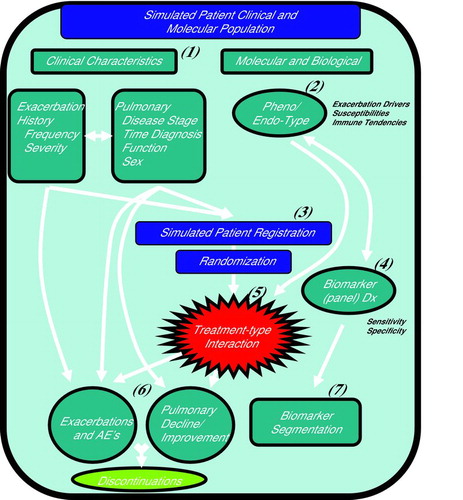
Diagram 2. Simulation Plan: Phase IIb trial simulated for study size, RRE, biomarker Dx cutoffs, and COPD phenotype prevalences. At the end of Phase IIb the Go/No Go decision made to pursue Phase III without a biomarker, with a biomarker (enrichment), or discontinue. The overall probability of Phase III success is weighted by the respective end of Phase IIb decision probabilities. Decision and success probabilities estimated from 5,000 simulated trial sequences.
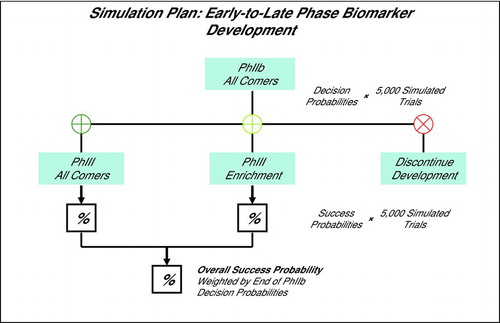
Diagram 3. Selected Simulation Results, Phase IIb Decision and Phase III Success Probabilities (a) Phase IIb simulated with N = 110 subjects per arm and biomarker Dx test sensitivity of 70%. There was a 46% probability of enriching with a biomarker in Phase III, and a 59% overall probability of Phase III success. (b) Increasing Phase IIb study size to N = 190 subjects per arm increased probability of enriching with biomarker in Phase III to 56%, and overall probability of Phase III success to 73%. (c) As in (b) although with increased Dx test sensitivity of 90%. Probability of enriching with biomarker in Phase III increased to 67%, while the overall probability of Phase III success of 75% was negligible from (b) at 73%.
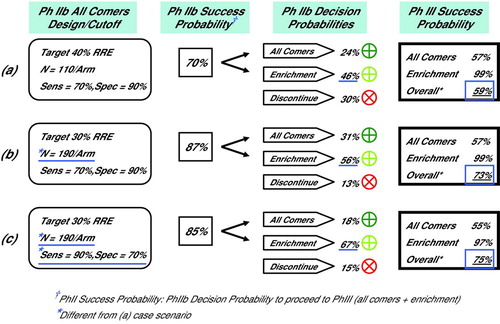
Table 1. Simulated Phase IIb Decision and Phase III Success Probabilities with a Biomarker, RRE = 25% to Targeted Treatment in the All Comers Population
Table 2. Simulated Phase IIb Decision and Phase III Success Probabilities with a Biomarker, RRE = 20% to Targeted Treatment in the All Comers Population
Table 3. Simulated Phase IIb Decision and Phase III Success Probabilities with a Biomarker, RRE = 25% to Targeted Treatment in the All Comers Population with Reduced Sensitivity and Specificity