
Figures & data
Table 1. Variables and point allocation used for the computation of the i-BODE index
Table 2. Baseline characteristics of patients attending the rehabilitation program according to subsequent survival and hospitalization
Table 3. Predictors of all-cause mortality
Figure 1. Survival curves (Kaplan-Meier) for the four quartiles of the i-BODE index. Quartile 1 is a score of 0 to 4, quartile 2 is a score of 5, quartile 3 is score of 6 and quartile 4 is a score of 7 to 10.
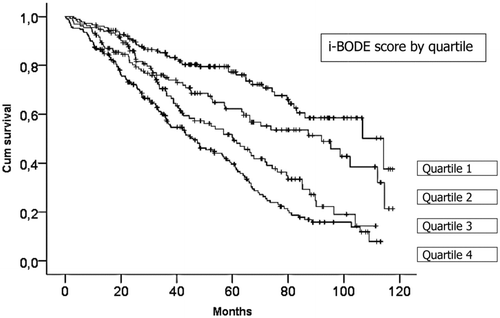
Figure 2. (a) Time to first admission for all causes (Kaplan-Meier). Log Rank = 32.5, p < 0.001. Quartile 1 is a score of 0 to 4, quartile 2 is a score of 5, quartile 3 is score of 6 and quartile 4 is a score of 7 to 10. (b) Time to first admission for COPD exacerbation (Kaplan-Meier). Log-Rank = 42.2; p < 0.001. Quartile 1 is a score of 0 to 4, quartile 2 is a score of 5, quartile 3 is score of 6 and quartile 4 is a score of 7 to 10.
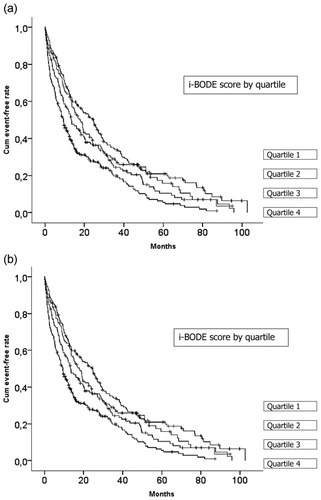
Table 4. Adjusted risk of hospitalization due to exacerbation in COPD and all causes