976
Views
30
CrossRef citations to date
0
Altmetric
ORIGINAL RESEARCH

Co-morbidities and Hyperinflation Are Independent Risk Factors of All-cause Mortality in Very Severe COPD

, , &

Figures & data

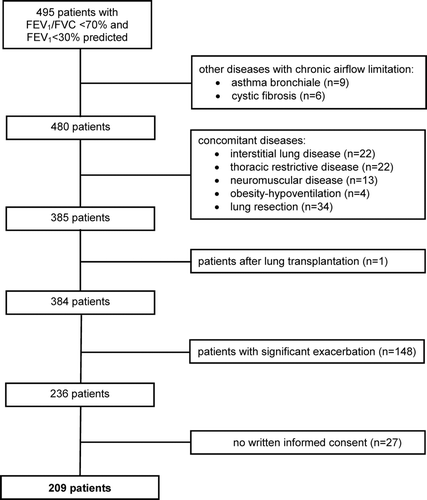
Figure 1.  Patients´ recruitment.

Figure 1.  Patients´ recruitment.

Table 1.  Patients’ characteristics and association with mortality

Table 2.  Co-morbidities and association with mortality

Figure 2a. Distribution of points of the COTE-index either < (light grey column) or ≥ (dark grey columns) the median value (1.0 (0.0–3.0)).
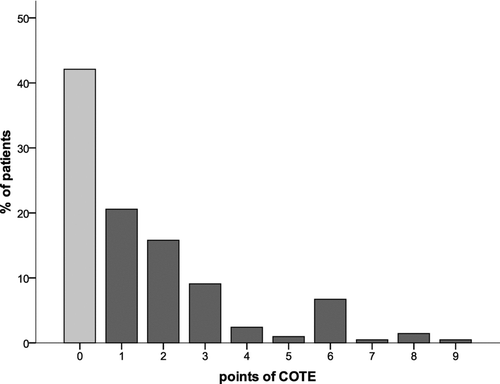
Figure 2a. Distribution of points of the COTE-index either < (light grey column) or ≥ (dark grey columns) the median value (1.0 (0.0–3.0)).

Table 3.  Combined scores and the risk of mortality

Figure 2b. Distribution of points of the age-COTE-index either < (light grey column) or ≥ (dark grey columns) the median value (3.0 (2.0–53.0)).
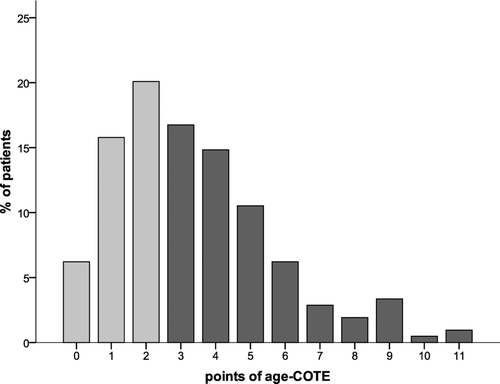
Figure 2b. Distribution of points of the age-COTE-index either < (light grey column) or ≥ (dark grey columns) the median value (3.0 (2.0–53.0)).

Figure 3a. Kaplan-Meier curve of RV/TLC either < (grey line, group 0) or ≥ (black line, group 1) the median value (76.84%; HR 2.095 (1.445–3.038), p < 0.001) regarding all-cause mortality.
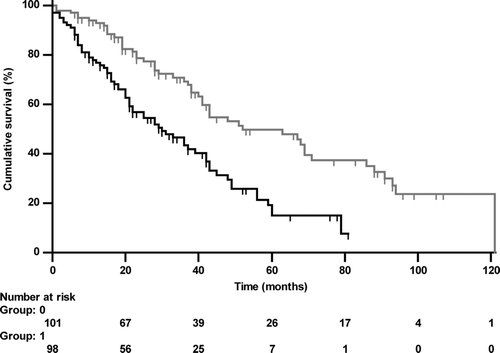
Figure 3a. Kaplan-Meier curve of RV/TLC either < (grey line, group 0) or ≥ (black line, group 1) the median value (76.84%; HR 2.095 (1.445–3.038), p < 0.001) regarding all-cause mortality.

Figure 3b. Kaplan-Meier curve of FEV1%predicted either < (black line, group 0) or ≥ (grey line, group 1) the median value (25.0%; HR 0.749 (0.521–1.077), p = 0.106) regarding all-cause mortality.
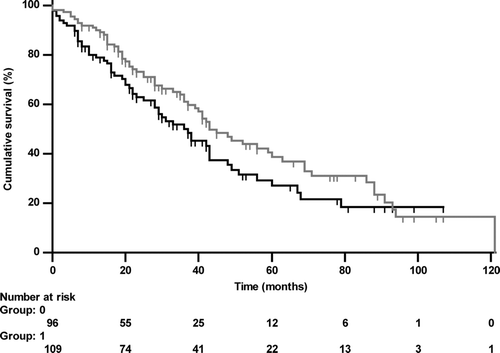
Figure 3b. Kaplan-Meier curve of FEV1%predicted either < (black line, group 0) or ≥ (grey line, group 1) the median value (25.0%; HR 0.749 (0.521–1.077), p = 0.106) regarding all-cause mortality.

Figure 3c. Kaplan-Meier curve of the COTE-index either < (grey line, group 0) or ≥ (black line, group 1) the median value (1.0; HR 1.911 (1.338–2.730), p < 0.001) regarding all-cause mortality.
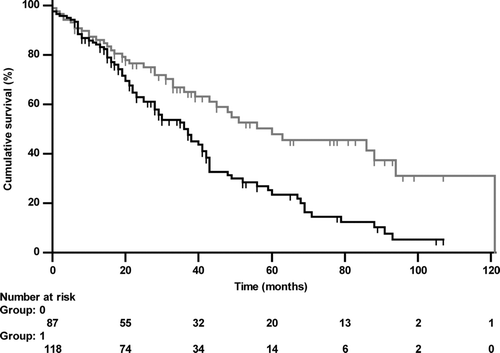
Figure 3c. Kaplan-Meier curve of the COTE-index either < (grey line, group 0) or ≥ (black line, group 1) the median value (1.0; HR 1.911 (1.338–2.730), p < 0.001) regarding all-cause mortality.

Figure 3d. Kaplan-Meier curve of the Charlson-index either < (grey line, group 0) or ≥ (black line, group 1) the median value (2.0; HR 1.852 (1.297–2.644), p < 0.001) regarding all-cause mortality.
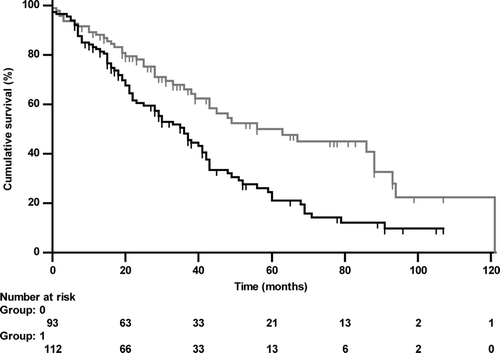
Figure 3d. Kaplan-Meier curve of the Charlson-index either < (grey line, group 0) or ≥ (black line, group 1) the median value (2.0; HR 1.852 (1.297–2.644), p < 0.001) regarding all-cause mortality.

Table 4a.  Multivariate analysis for death from any cause using the respective median

Table 4b.  Multivariate analysis for death from respiratory cause using the respective median

Reprints and Corporate Permissions

Please note: Selecting permissions does not provide access to the full text of the article, please see our help page How do I view content?

To request a reprint or corporate permissions for this article, please click on the relevant link below:

Academic Permissions

Please note: Selecting permissions does not provide access to the full text of the article, please see our help page How do I view content?

Obtain permissions instantly via Rightslink by clicking on the button below:

If you are unable to obtain permissions via Rightslink, please complete and submit this Permissions form. For more information, please visit our Permissions help page.