Figures & data
Table 1. Distribution of age and gender in patients with COPD and controls
Table 2. Health costs and income of COPD patients before and after diagnosis compared with controls
Figure 1. Health costs of COPD and controls in Euros distributed by age and gender.
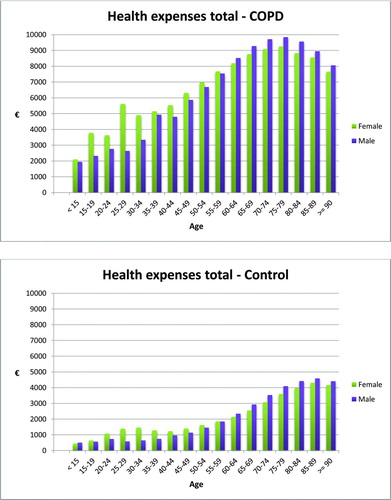
Table 3. Percentage of spouses of COPD patients (after diagnosis) and controls receiving various health care services and income
Table 4. Health costs and income of spouses of COPD-patients before and after diagnosis compared with controls
Figure 2a. Income from employment of COPD patients and controls in Euros distributed by age and gender.
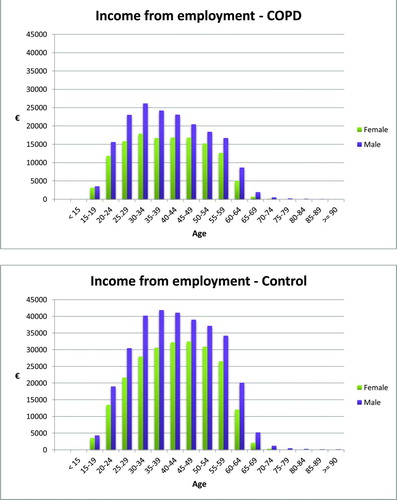
Figure 2b. Public transfer income from employment of COPD patients and controls in Euros distributed by age and gender.
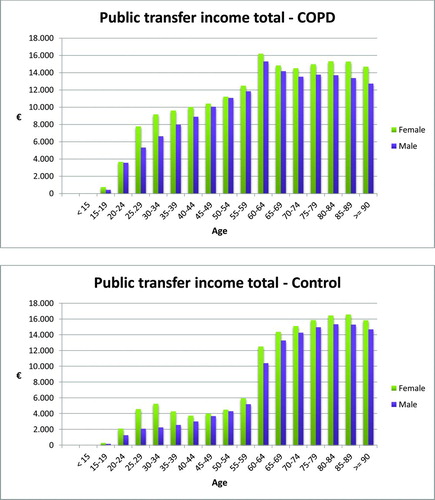
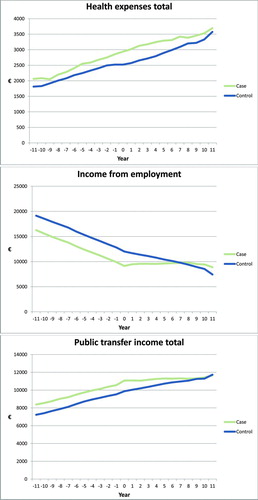
Figure 3. Total health expenses, income from employment and public transfer income in Euros of spouses before and after diagnosis of COPD (green) compared with controls (blue).