Figures & data
Table 1. Participant characteristics and exercise responses
Figure 1. Physiological responses to exercise tests at 4 different constant work rates (CWR) in COPD and healthy subjects (HLTH). Upper panels: Power-duration relationships in COPD and HLTH (horizontal dashed line is the critical power asymptote). Middle panels: Oxygen uptake (VO2) responses to 4 different CWR tests in COPD and HLTH (horizontal dashed line is VO2max from the ramp-incremental test). Bottom panels: Responses of ventilation (VE) to 4 different CWR tests in COPD and HLTH (horizontal dashed line is estimated maximum voluntary ventilation). Vertical dashed line in all panels represents start of the CWR bouts.
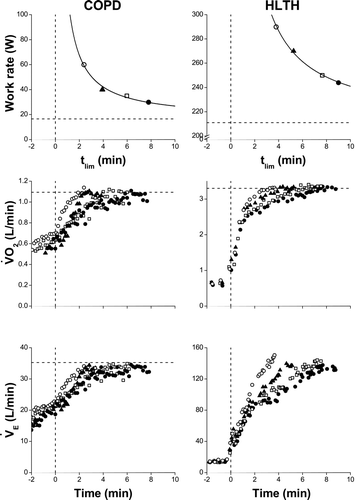
Table 2. Comparison between the results of the prediction algorithm for a constant work rate that results in exercise intolerance in 6 minutes (WR6-pred) and the true WR6 interpolated from the known power-duration relationship (WR6-true) in the validation cohort of COPD patients and healthy subjects
Figure 2. Comparison between the predicted and measured values for the constant work rate that results in intolerance in 6 minutes (WR6) in the validation cohort of COPD patients. A) Regression between predicted WR6 (WR6-pred) and the true WR6 (WR6-true) determined from interpolation of the P-tlim relationship. Solid line is the linear regression and dashed line is the line of identity. B) Difference plot between WR6-pred and WR6-true. Note the small mean bias (–3.2 W; solid line), wide 95% confidence intervals (–14.7 to +8.4 W; short dash), and bias in the distribution (long dash). C) Frequency distribution for the difference between WR6-pred and WR6-true. The data are fit to a Gaussian distribution (solid line) and zero difference is indicated (vertical dash). D) Frequency distribution for the tlim at the WR6-pred. The data are fit to a Gaussian distribution (solid line) and the target 6 minutes is indicated (vertical dash).
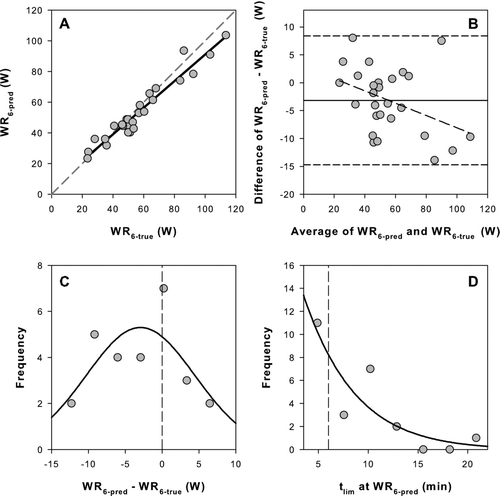
Figure 3. Comparison between the predicted and measured values for the constant work rate that results in intolerance in 6 minutes (WR6) in the validation cohort of healthy subjects (HLTH). A) Regression between predicted WR6 (WR6-pred) and the true WR6 (WR6-true) determined from interpolation of the P-tlim relationship. Solid line is the linear regression and dashed line is the line of identity. B) Difference plot between WR6-pred and WR6-true. Note the small mean bias (3.5 W; solid line), wide 95% confidence intervals (–8.8 to +15.8 W; short dash), and bias in the distribution (long dash). C) Frequency distribution for the difference between WR6-pred and WR6-true. The data are fit to a Gaussian distribution (solid line) and zero difference is indicated (vertical dash). D) Frequency distribution for the tlim at the WR6-pred. The data are fit to a Gaussian distribution (solid line) and the target 6 minutes is indicated (vertical dash).
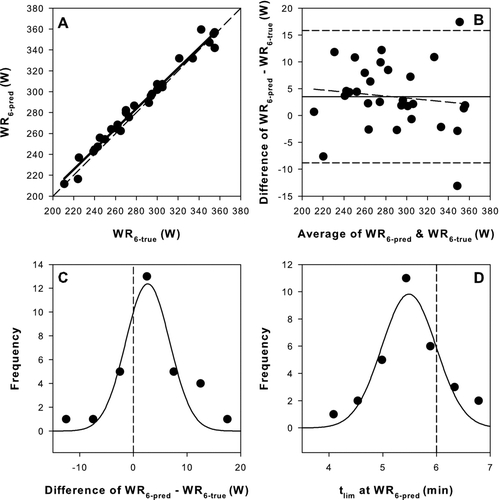
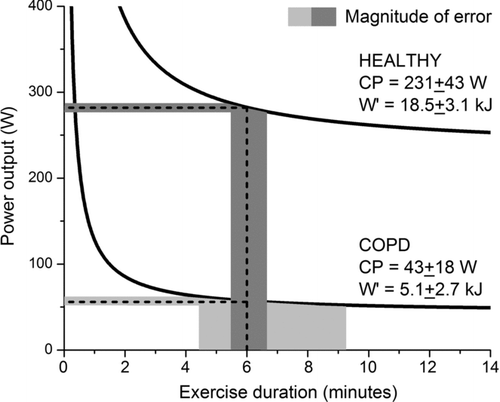
Figure 4. An illustration of the magnitude of error in predicting exercise duration (tlim) for an assumed 5W error on WR6 prediction in healthy subjects and COPD patients. Power-duration (P-tlim) curve and WR6 estimates are based on the means of the two groups (). A 5W error in WR6 prediction in HLTH projects to a small variation in tlim (5.5 to 6.6 minutes; dark grey shading), whereas the same error in COPD projects to a large variation in tlim (4.4 to 9.3 minutes; light grey shading). The difficulty in estimating a common CWR duration for both groups is suggested to be markedly influenced by the very low curvature constant (W´) in COPD (5.1 ± 2.7 kJ) compared to HLTH (18.5 ± 3.1 kJ). The selection of a 5W error is based on the typical SEE for WR6 estimation using the P-tlim curve (range ∼1–7 W in this study). It is noted that, were the precision of WR6 estimation to be lower in COPD, then the wide tlim distribution would be exacerbated in patients compared to healthy subjects.