1,255
Views
12
CrossRef citations to date
0
Altmetric
ORIGINAL RESEARCH

COPD Exacerbation Frequency, Pharmacotherapy and Resource Use: An Observational Study in UK Primary Care

, , &
Pages 300-309 | Published online: 23 Oct 2013

Figures & data

Table 1.  Number of patients consenting / included at each centre

Table 2.  Patient demographics and study sample

Figure 1.  Distribution of number of COPD exacerbations/year, by disease severity.

Figure 1.  Distribution of number of COPD exacerbations/year, by disease severity.

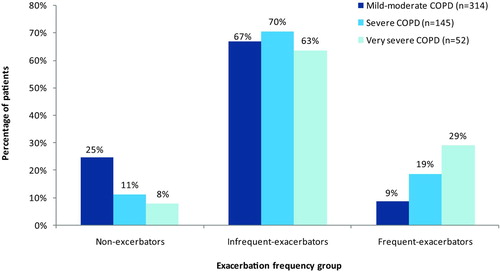
Table 3.  Recorded co-morbidities, stratified by exacerbation frequency

Figure 2.  Distribution of personnel seen during COPD-related primary care contacts for routine or exacerbation management. aPercentage of all recorded primary care contacts occurring during the study period. Includes GP surgery visits, home visits and telephone contacts. b'Other’ is comprised predominantly of Community Respiratory Team and physiotherapist contacts.

Figure 2.  Distribution of personnel seen during COPD-related primary care contacts for routine or exacerbation management. aPercentage of all recorded primary care contacts occurring during the study period. Includes GP surgery visits, home visits and telephone contacts. b'Other’ is comprised predominantly of Community Respiratory Team and physiotherapist contacts.

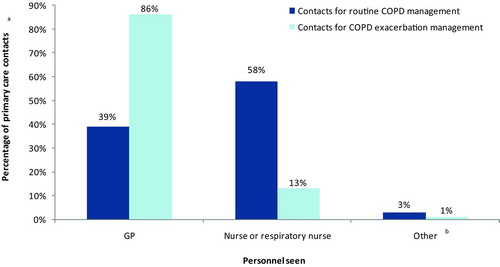
Table 4.  Resource use, stratified by COPD severity

Table 5.  Resource use, stratified by exacerbation frequency

Figure 3.  Proportion of patients prescribed ICS during the study period, according to COPD severity, presence of asthma and exacerbation frequency. an values show the total number of patients within each sub-group. bThe boxes below the n values show the number (and percentage) of patients within each sub-group who were prescribed ICS during the study period.

Figure 3.  Proportion of patients prescribed ICS during the study period, according to COPD severity, presence of asthma and exacerbation frequency. an values show the total number of patients within each sub-group. bThe boxes below the n values show the number (and percentage) of patients within each sub-group who were prescribed ICS during the study period.

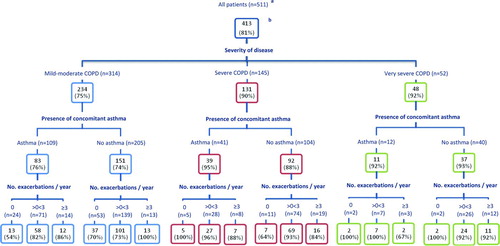
Table 6.  Drug treatments prescribed for routine COPD management during the observation period –according to exacerbation frequency

Reprints and Corporate Permissions

Please note: Selecting permissions does not provide access to the full text of the article, please see our help page How do I view content?

To request a reprint or corporate permissions for this article, please click on the relevant link below:

Academic Permissions

Please note: Selecting permissions does not provide access to the full text of the article, please see our help page How do I view content?

Obtain permissions instantly via Rightslink by clicking on the button below:

If you are unable to obtain permissions via Rightslink, please complete and submit this Permissions form. For more information, please visit our Permissions help page.