
Figures & data
Table 1. Characteristics of the study groups
Figure 1. Flow of patients from initial screening to the final study group assignments.
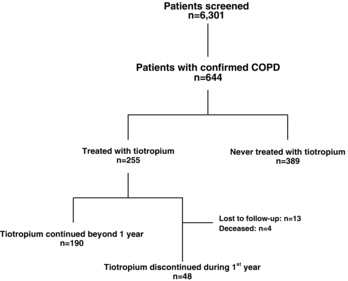
Table 2. Single variable logistic regression analysis of the factors correlated with continuation of tiotropium bromide beyond 1 year after its introduction
Table 3. Multiple variable logistic regression analysis of the factors correlated with continuation of treatment with tiotropium bromide beyond 1 year after its introduction
Figure 2. Kaplan–Meier estimates of cumulative probability of discontinuation of tiotropium bromide in 255 patients.
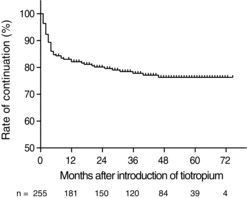
Figure 3. Kaplan–Meier estimates of cumulative probability of discontinuation of tiotropium bromide according to a) former versus current smoker status, b) ≥50% versus <50% FEV1, c) alleviation versus no alleviation of symptoms, and d) exacerbation versus no exacerbation of COPD during first year of treatment with tiotropium bromide. The p-values were calculated by log-rank test.
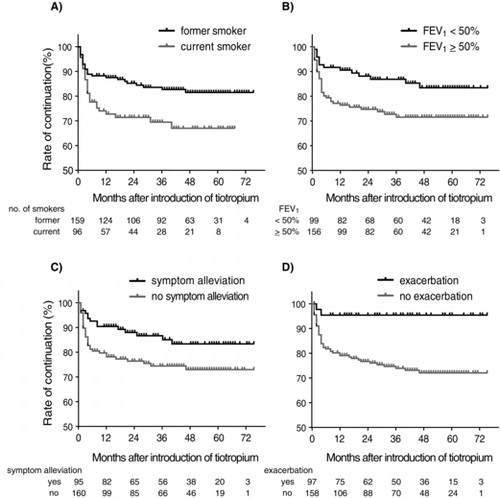
Table 4. Cox proportional hazards regression analysis of factors correlated with continuation of treatment with tiotropium bromide beyond 1 year