Figures & data
Table 1. Demographic characteristics and comprehensive indices of pulmonary function for all COPD patients evaluated at baseline visit
Table 2. Indices of lung function parameters for COPD patients participating in both baseline and follow-up visits, n = 34
Table 3. Baseline lung function values in lower, middle and upper tertiles of 12-minute walk distance at baseline
Table 4. Stepwise regression models of determinants of 12-minute walk distance
Figure 1. Explanatory value (expressed in r2-values from simple linear regression models) of each of the lung function parameters at baseline for the patients’ exercise capacity at baseline. *Indicates significant relation (p < 0.05).
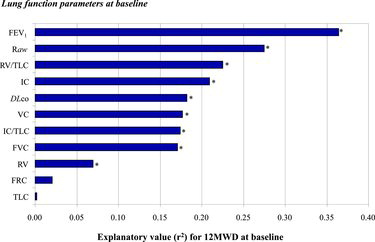
Figure 2. Explanatory value (expressed in r2-values from simple linear regression models) of each of the lung function parameters at follow-up for the patients’ 12MWD at follow-up. *Indicates significant relation (p < 0.05).
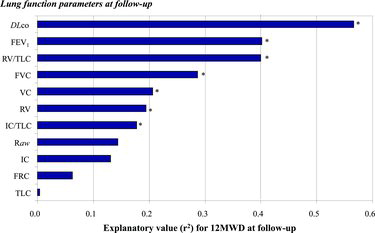
Figure 3. Explanatory value (expressed in r2-values from simple linear regression models) of each of the lung function parameters at baseline for the changes in 12MWD during 5-year follow-up. *Indicates significant relation (p < 0.05).
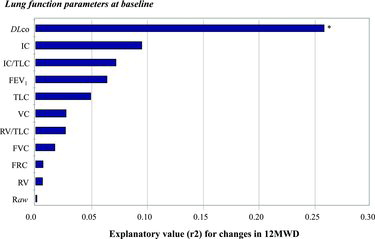
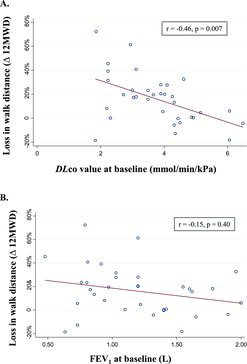
Figure 4. (A) Scatter plot for changes in 12MWD (y-axis) as function of DLco (x-axis), including regression line. (B) Scatter plot for changes in 12MWD (y-axis) as function of FEV1 (x-axis), including regression line.