
Figures & data
Figure 1. (A) Upper slice (at the superior border of the aortic arch) transferred to the post-processing workstation, where quantitative lung density analysis was performed using the Pulmo CT program. (B) Histogram of distribution of lung attenuation values, measured in HU in the upper slice (at the superior border of the aortic arch) for several potential emphysema thresholds.
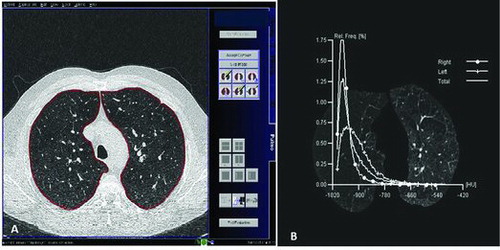
Table 1. Baseline characteristics of the study population
Table 1. Baseline characteristics of the study population
Table 2. Comparison of exercise parameters between patients with heterogeneous and homogeneous emphysema
Table 3. Correlations between emphysema distribution and exercise parameters, for both emphysema thresholds