
Figures & data
Table 1. Demographics
Figure 1. All-cause in-hospital mortality rates in patients hospitalized with COPD exacerbation.
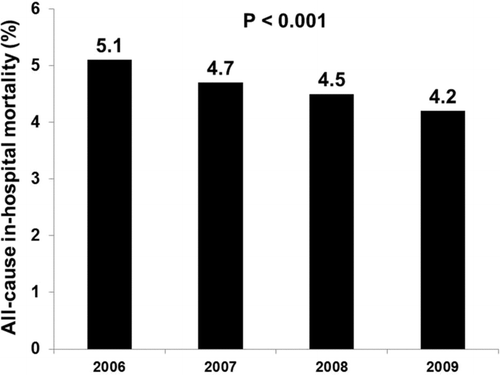
Figure 2. Rates of (A) mechanical ventilation and (B) noninvasive positive pressure ventilation in patients hospitalized with COPD exacerbation.
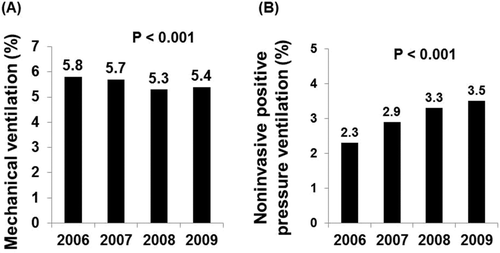
Figure 3. Average hospital length of stay in days in patients hospitalized with COPD exacerbation.
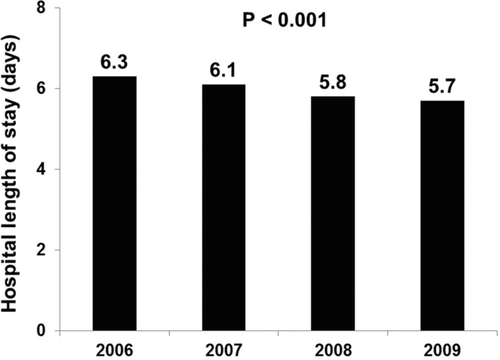
Table 2. Multivariate logistic regression models
Table 3. Multivariate linear regression of hospital length of stay
Table 4. Multivariate logistic regression models for in-hospital mortality for each discharge year