Figures & data
Figure 1. Distribution of registered members, and usage of augmentation therapy (italics), given in absolute number and number per million (brackets).
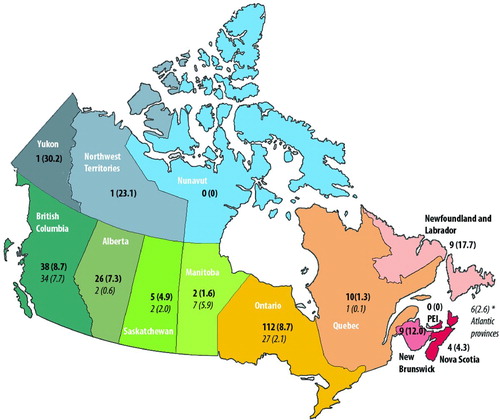
Table 1. General characteristics of registry participants (n = 29)
Table 2. Characteristics of patients diagnosed due to lung disease
Figure 2. SGRQ scores at most recent follow-up for 106 patients, sorted by FEV1% predicted.