
Figures & data
Table 1. Clinical characteristics of the patient population.
Figure 1. Distribution of estimated annual change in FEV1 among the COPD patients.
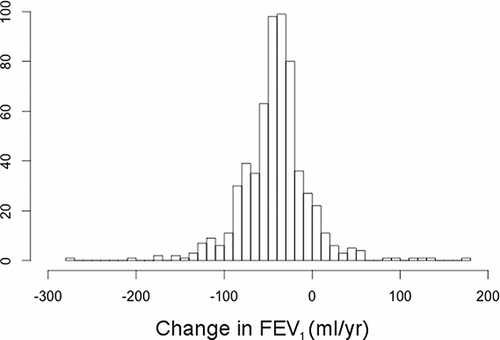
Table 2. Comparison of lung function at the beginning of the follow-up, the change during the follow-up and certain demographic characteristics that potentially affect the results among the decliners and non-decliners based on FEV1.
Figure 2. Distribution of estimated annual decline in FEV1 in the rapid decliners.
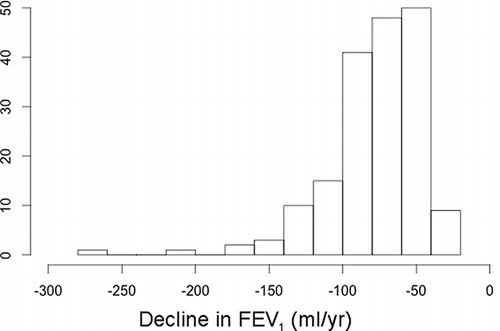
Figure 3. A panel chart of FEV1 slopes for a random sample of study subjects with varying number of measurements available. At 95% probability level HBM identified patients as rapid decliners (black), improvers (white) or patients whose lung function development was considered to present random variation (grey).
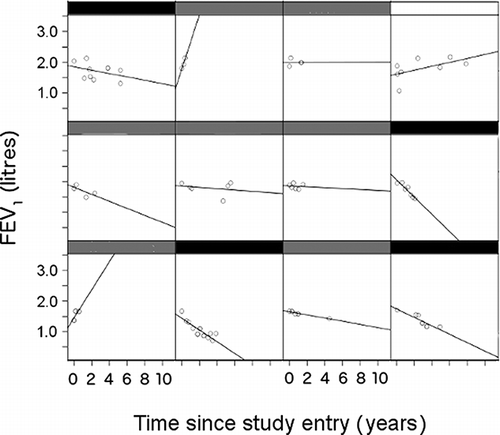
Table 3. Clinical characteristics and events associated with the risk of being a rapid FEV1 decliner.