
Figures & data
Figure 1. Patient inclusion and exclusion criteria for the cohort of patients with COPD (chronic obstructive pulmonary disease).
Table 1. Patient characteristics with pulmonary hypertension threshold of mean pulmonary artery pressure ≥ 25 mmHg
Table 2. Patient characteristics with pulmonary hypertension threshold of mean pulmonary artery pressure ≥ 35 mmHg
Table 3. Univariate survival analysis (N = 1243)
Figure 2. Kaplan–Meier survival functions comparing pulmonary hypertension and no pulmonary hypertension in patients with chronic obstructive pulmonary disease using mean pulmonary artery pressure ≥25 mmHg as the threshold (N = 1243), Log-rank test: Chi-square (df = 1): 15.87, p < 0.0001. PH = pulmonary hypertension.
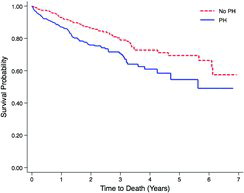
Figure 3. Kaplan-Meier survival functions comparing pulmonary hypertension and no pulmonary hypertension in patients with chronic obstructive pulmonary disease using mean pulmonary artery pressure ≥35 mmHg as the threshold (N = 1243), Log-rank test: Chi-square (df = 1): 50.13, p < 0.0001. PH = pulmonary hypertension.
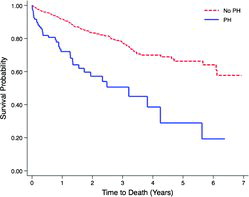
Table 4. Multivariate survival analysis with mean pulmonary artery pressure ≥25 mmHg as the pulmonary hypertension threshold (N = 1243)
Table 5. Multivariate survival analysis with mean pulmonary artery pressure ≥35 mmHg as the pulmonary hypertension threshold (N = 1243)