
Figures & data
Figure 1. Data collection flow chart.
Table 1. Patient characteristics by level of care
Figure 2. Correlation between CAT and CCQ scores. The regression equation describes the linear association between CAT total score and CCQ total mean score.
Table 2. Factors influencing health status assessed by CAT and CCQ
Table 3. Comparison of factors influencing CAT and CCQ
Figure 3. Comparison CAT and CCQ. Adjusted regression coefficients (95%CI) for variables associated with health status in multiple linear regression with standardised CAT and CCQ scores.
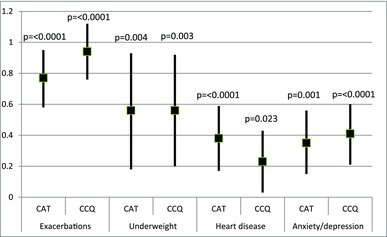
Table 4. Stratification and interaction analyses by sex