758
Views
5
CrossRef citations to date
0
Altmetric
ORIGINAL RESEARCH

Montelukast versus Dexamethasone Treatment in a Guinea Pig Model of Chronic Pulmonary Neutrophilic Inflammation

Pages 455-463 | Received 28 Feb 2015, Accepted 24 Apr 2015, Published online: 11 Jan 2016

Figures & data

Figure 1. Schedule of the study: Chronic (9 exposures, 48 hours apart) exposure (60 min) to nebulized lipopolysaccharides (LPS) (30 μg/ml) or vehicle (pathogen-free saline) of conscious guinea pigs, with and without Montelukast or dexamethasone treatment. Airway hyperreactivity (AHR) was measured at 48 hours after the final exposure to LPS, bronchoalveolar lavage fluid (BALF) was conducted for cellular analysis and tumor necrosis factor (TNF) α level measurement. Lungs for malondialdehyde, histone deacetylase activity and histological analysis) were collected at 48 hours. Test drugs were administered every day, usually 30 minutes before exposure on days of LPS challenge.
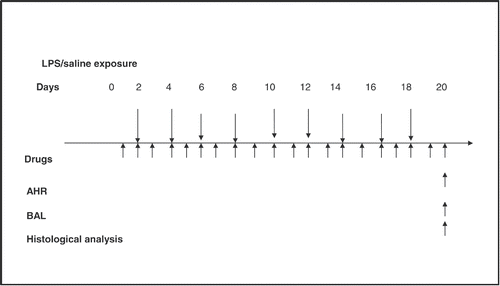
Figure 1. Schedule of the study: Chronic (9 exposures, 48 hours apart) exposure (60 min) to nebulized lipopolysaccharides (LPS) (30 μg/ml) or vehicle (pathogen-free saline) of conscious guinea pigs, with and without Montelukast or dexamethasone treatment. Airway hyperreactivity (AHR) was measured at 48 hours after the final exposure to LPS, bronchoalveolar lavage fluid (BALF) was conducted for cellular analysis and tumor necrosis factor (TNF) α level measurement. Lungs for malondialdehyde, histone deacetylase activity and histological analysis) were collected at 48 hours. Test drugs were administered every day, usually 30 minutes before exposure on days of LPS challenge.

Figure 2. Effect of oral treatment with Montelukast (10 and 30 mg/kg) and dexamethasone on airway function of conscious guinea pigs during base line, after first exposure and after chronic exposure (9 times) to LPS (30 mg/ml) or vehicle (saline) inhalation, for 1 hour, 48 hours apart. Drug treatment started 1 day before LPS exposure and continued daily for 20 days. Airway function was expressed as specific airway resistance (sRaw). Each point represents the mean ± S.E.M. (n = 6). Significance of differences from saline exposure (*, p < 0.05), significance of differences from LPS exposures (#, p < 0.05) and significance of differences from dexamethasone treatment ($, p < 0.05) were determined by analysis of variance (single factor), followed by Newman–Keuls Multiple Comparison Test.
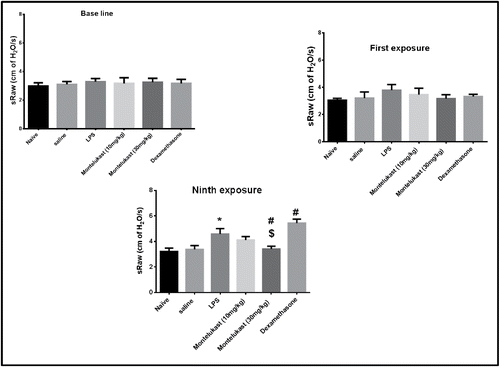
Figure 2. Effect of oral treatment with Montelukast (10 and 30 mg/kg) and dexamethasone on airway function of conscious guinea pigs during base line, after first exposure and after chronic exposure (9 times) to LPS (30 mg/ml) or vehicle (saline) inhalation, for 1 hour, 48 hours apart. Drug treatment started 1 day before LPS exposure and continued daily for 20 days. Airway function was expressed as specific airway resistance (sRaw). Each point represents the mean ± S.E.M. (n = 6). Significance of differences from saline exposure (*, p < 0.05), significance of differences from LPS exposures (#, p < 0.05) and significance of differences from dexamethasone treatment ($, p < 0.05) were determined by analysis of variance (single factor), followed by Newman–Keuls Multiple Comparison Test.
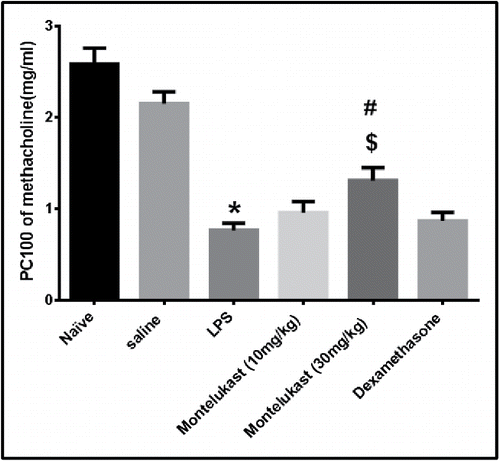
Table 1. Effect of pretreatment with montelukast and dexamethasone on airway hyperresponsiveness (AHR) to methacholine (Mch) in chronic LPS exposed guinea pigs

Figure 3. Effect of oral treatment with Montelukast (10 and 30mg/kg) and dexamethasone on airway hyperreactivity (AHR). AHR was examined 48 hours after the 9th exposure to LPS with increasing concentration of methacholine. Airway hyperreactivity is expressed as PC100 (the methacholine dose, in mg/kg, at which 100% bronchoconstriction was induced. Values given are means ± S.E.M. (n = 6). Significance of differences from saline exposure (*, p < 0.05), significance of differences from LPS exposures (#, p < 0.05) and significance of differences from dexamethasone treatment ($, p < 0.05) were determined by analysis of variance (single factor), followed by Newman–Keuls Multiple Comparison Test.
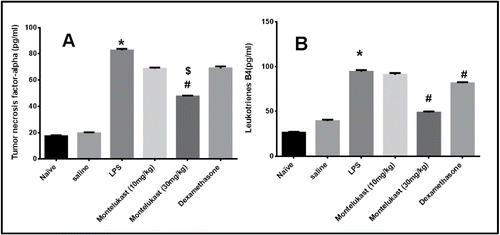
Figure 3. Effect of oral treatment with Montelukast (10 and 30mg/kg) and dexamethasone on airway hyperreactivity (AHR). AHR was examined 48 hours after the 9th exposure to LPS with increasing concentration of methacholine. Airway hyperreactivity is expressed as PC100 (the methacholine dose, in mg/kg, at which 100% bronchoconstriction was induced. Values given are means ± S.E.M. (n = 6). Significance of differences from saline exposure (*, p < 0.05), significance of differences from LPS exposures (#, p < 0.05) and significance of differences from dexamethasone treatment ($, p < 0.05) were determined by analysis of variance (single factor), followed by Newman–Keuls Multiple Comparison Test.

Table 2. Effect of oral treatment with montelukast or dexamethasone on airway influx of inflammatory cells (leukocytes count) after chronic exposure to LPS or saline

Figure 4. Effect of oral treatment with Montelukast (Mont) (10 and 30 mg/kg) and dexamethasone (Dex) on release of A: Tumor necrosis factor-α. B: Leukotriene B4 in BALF 48 hours after the 9th exposure to LPS in guinea pigs. Each column shows means ± S.E.M. (n = 6). Significance of differences from saline exposure (*, p < 0.05), significance of differences from LPS exposures (#, p < 0.05) and significance of differences from dexamethasone treatment ($, p < 0.05) were determined by analysis of variance (single factor), followed by Newman–Keuls Multiple Comparison Test.

Figure 4. Effect of oral treatment with Montelukast (Mont) (10 and 30 mg/kg) and dexamethasone (Dex) on release of A: Tumor necrosis factor-α. B: Leukotriene B4 in BALF 48 hours after the 9th exposure to LPS in guinea pigs. Each column shows means ± S.E.M. (n = 6). Significance of differences from saline exposure (*, p < 0.05), significance of differences from LPS exposures (#, p < 0.05) and significance of differences from dexamethasone treatment ($, p < 0.05) were determined by analysis of variance (single factor), followed by Newman–Keuls Multiple Comparison Test.

Figure 5. Effect of oral treatment with Montelukast (10 and 30 mg/kg) and dexamethasone on A: MDA (malondialdehyde) level and B: HDAC (Histone deacetylase) activity in lung tissue homogenate 48 hours after the 9th exposure to LPS in guinea pigs. Each column shows means ± S.E.M. (n = 6). Significance of differences from saline exposure (*, p < 0.05), significance of differences from LPS exposures (#,p < 0.05) and significance of differences from dexamethasone treatment ($, p < 0.05) were determined by analysis of variance (single factor), followed by the Newman–Keuls Multiple Comparison Test.
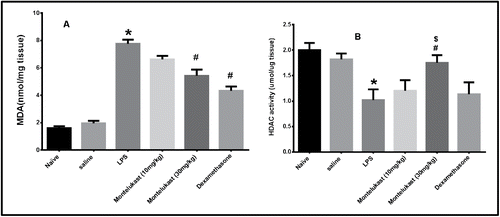
Figure 5. Effect of oral treatment with Montelukast (10 and 30 mg/kg) and dexamethasone on A: MDA (malondialdehyde) level and B: HDAC (Histone deacetylase) activity in lung tissue homogenate 48 hours after the 9th exposure to LPS in guinea pigs. Each column shows means ± S.E.M. (n = 6). Significance of differences from saline exposure (*, p < 0.05), significance of differences from LPS exposures (#,p < 0.05) and significance of differences from dexamethasone treatment ($, p < 0.05) were determined by analysis of variance (single factor), followed by the Newman–Keuls Multiple Comparison Test.
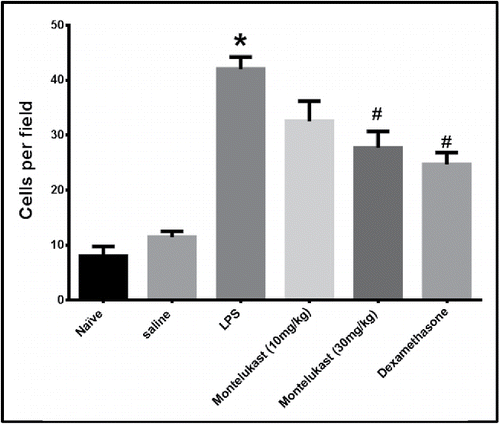
Figure 6. Effect of oral treatment with Montelukast (10 and 30 mg/kg) and dexamethasone on average number of inflammatory cells in 10 randomly chosen fields (500-μm squares) measured from 10 randomly selected lines passing through the lung in H & E stained sections taken 48 hours after the 9th exposure to LPS. Each column represents means ± S.E.M. (n = 6). Significance of differences from saline exposure (*, p < 0.05), and significance of differences from LPS exposures (#, p < 0.05) were determined by analysis of variance (single factor), followed by the Newman–Keuls Multiple Comparison Test.

Figure 6. Effect of oral treatment with Montelukast (10 and 30 mg/kg) and dexamethasone on average number of inflammatory cells in 10 randomly chosen fields (500-μm squares) measured from 10 randomly selected lines passing through the lung in H & E stained sections taken 48 hours after the 9th exposure to LPS. Each column represents means ± S.E.M. (n = 6). Significance of differences from saline exposure (*, p < 0.05), and significance of differences from LPS exposures (#, p < 0.05) were determined by analysis of variance (single factor), followed by the Newman–Keuls Multiple Comparison Test.

Reprints and Corporate Permissions

Please note: Selecting permissions does not provide access to the full text of the article, please see our help page How do I view content?

To request a reprint or corporate permissions for this article, please click on the relevant link below:

Academic Permissions

Please note: Selecting permissions does not provide access to the full text of the article, please see our help page How do I view content?

Obtain permissions instantly via Rightslink by clicking on the button below:

If you are unable to obtain permissions via Rightslink, please complete and submit this Permissions form. For more information, please visit our Permissions help page.