Figures & data
Table 1. Demographic, pulmonary function, CT density and lung MRI T1 data
Figure 1. Representative coronal lung MRI T1 maps overlaid on a signal intensity image with corresponding normalised T1 histograms for healthy, moderate COPD and severe COPD subjects. Both T1 maps and histograms reflected the severity of COPD by reduced T1 and increased heterogeneity.
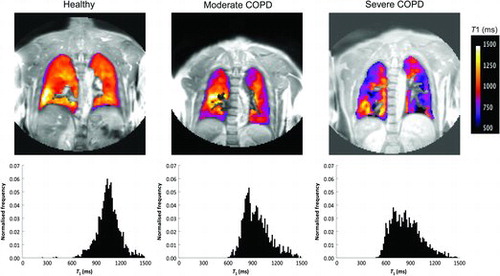
Figure 2. Global lung T1 (a) and regional IQR of T1 (b) for healthy (), moderate COPD (▲) and severe COPD () subjects. T1 was significantly shorter for the moderate COPD (p < 0.0001) and severe COPD subjects (p < 0.0001) than in the healthy controls. IQR of T1 was significantly larger for the moderate COPD (p < 0.0001) and severe COPD subjects (p = 0.0002) than in the healthy controls. No statistically significant differences in T1 and IQR of T1 were found between the COPD subjects. The error bars indicate standard deviation of the mean.
Figure 3. Lung T1 as a function of CT density measurements RA950 (a) and PD15 (b), for moderate COPD (▲) and severe COPD () subjects. Significant correlations between lung T1 and RA950 (r = −0.63, p = 0.001) and PD15 (r = 0.50, p = 0.017) were found.
Figure 4. Lung T1 as a function of PFT parameters FEV1 (a), FEV1/ FVC (b) and DLCO/VA (c), for healthy (), moderate COPD (▲) and severe COPD () subjects. Strong significant correlations (p < 0.0001) between lung T1 and all PFT parameters; FEV1 (r = 0.74), FEV1/FVC (r = 0.77) and DLCO/VA (r = 0.75) were observed.