
Figures & data
Table 1. Background characteristics of the COPD patients and male smokers.
Table 2. Risk factors for increased mortality in the study cohorts.
Figure 1. Kaplan-Meier curves of overall survival during the follow up according to rs1051730 genotype (GG wild-type: solid line, GA heterozygote: dashed line, and AA homozygote: dotted line) in the COPD (left) and male smokers (right) cohorts. In COPD cohort the difference between the groups by log rank analysis is p = 0.03, in male smokers p < 0.01.
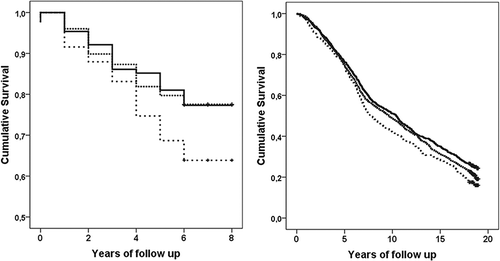
Table A1. Risk factors for having >40 pack-years
Table A2. Risk factors for having any type of cancer