
Figures & data
Figure 1. Tracing (dotted line) of right ventricular velocity time integral (RVSmVTI) from tissue Doppler obtained from the lateral tricuspid annulus.
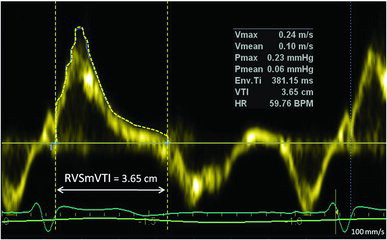
Table 1. Baseline characteristics of study participants
Table 2. Hemodynamic and echocardiographic characteristics in COPD
Figure 2. The panels A, C, E and G, show the relationship between heart rate adjusted pulmonary artery acceleration time (HR-adjusted PAAcT), the tissue Doppler derived right ventricle (RV) systolic myocardial velocity time integral (RVSmVTI), RV dimension to time to peak (RVD/Tpeak) and mPAP derived from Doppler echocardiography by the standard equation: [(0.61 × systolic artery pressure (sPAP)) + 2 mmHg] versus invasive mean pulmonary artery pressure (mPAP), respectively. The horizontal dashed lines represent definition of pulmonary hypertension (mPAP ≥ 25 mm Hg) by invasive right heart catheterization, while the vertical dashed lines reflect elevated mPAP by the PH cutoff value of the echo indices. The number within each quadrant of true-positive, false-negative, false-positive, and true-negative results are shown in the right plots. The red and green dots show misclassified and correctly classified patients, respectively. In panel B, D, F and H corresponding Bland-Altman plots are shown for observed minus estimated mPAP, based on regression equations from the derivation group, versus the average of predicted minus observed values of mPAP. The horizontal lines correspond to the mean difference and 95% limits of agreement. Less accuracy of Doppler echocardiography in estimating mPAP is apparent at high mPAP.
![Figure 2. The panels A, C, E and G, show the relationship between heart rate adjusted pulmonary artery acceleration time (HR-adjusted PAAcT), the tissue Doppler derived right ventricle (RV) systolic myocardial velocity time integral (RVSmVTI), RV dimension to time to peak (RVD/Tpeak) and mPAP derived from Doppler echocardiography by the standard equation: [(0.61 × systolic artery pressure (sPAP)) + 2 mmHg] versus invasive mean pulmonary artery pressure (mPAP), respectively. The horizontal dashed lines represent definition of pulmonary hypertension (mPAP ≥ 25 mm Hg) by invasive right heart catheterization, while the vertical dashed lines reflect elevated mPAP by the PH cutoff value of the echo indices. The number within each quadrant of true-positive, false-negative, false-positive, and true-negative results are shown in the right plots. The red and green dots show misclassified and correctly classified patients, respectively. In panel B, D, F and H corresponding Bland-Altman plots are shown for observed minus estimated mPAP, based on regression equations from the derivation group, versus the average of predicted minus observed values of mPAP. The horizontal lines correspond to the mean difference and 95% limits of agreement. Less accuracy of Doppler echocardiography in estimating mPAP is apparent at high mPAP.](/cms/asset/de201781-43f7-42a8-bccf-b06461b14b7a/icop_a_1057275_f0002_c.jpg)
Figure 3. Scatterplots showing the relation between invasive pulmonary vascular resistance (PVR) versus heart rate adjusted pulmonary artery acceleration time (HR-adjusted PAAct) (panel A), right ventricular systolic velocity time integral (RVSmVTI) (panel C) and the recommended method by the Tricuspid regurgitation peak velocity/[(RV outflow tract pulsed Doppler VTI × 10)+0.16] (panel E). Correctly and misclassified subjects are illustrated by green and red dots, respectively. Bland-Altman plots of predicted minus observed PVR (vertical axis) against mean of observed and predicted PVR (horizontal axis) for PAAcT (panel B), RVSmVTI (panel D) and the recommended echo method (panel F). Good agreement with negligible mean difference and narrow limits of agreement for all three indices were observed; however, a tendency for greater negative differences with greater PVR, seen in both panel B, D and F.
![Figure 3. Scatterplots showing the relation between invasive pulmonary vascular resistance (PVR) versus heart rate adjusted pulmonary artery acceleration time (HR-adjusted PAAct) (panel A), right ventricular systolic velocity time integral (RVSmVTI) (panel C) and the recommended method by the Tricuspid regurgitation peak velocity/[(RV outflow tract pulsed Doppler VTI × 10)+0.16] (panel E). Correctly and misclassified subjects are illustrated by green and red dots, respectively. Bland-Altman plots of predicted minus observed PVR (vertical axis) against mean of observed and predicted PVR (horizontal axis) for PAAcT (panel B), RVSmVTI (panel D) and the recommended echo method (panel F). Good agreement with negligible mean difference and narrow limits of agreement for all three indices were observed; however, a tendency for greater negative differences with greater PVR, seen in both panel B, D and F.](/cms/asset/2050f3b3-a7d3-4fd4-a678-edf21ba65d14/icop_a_1057275_f0003_c.jpg)
Figure 4. Comparative receiver operating characteristic curve analyses are presented in 50 patients (derivation group) for; heart rate adjusted pulmonary artery (HR-adjusted PAAcT), right ventricular (RV) systolic velocity time integral (HR-adjusted RVSmVTI), RV diameter (RVD)/time to peak Sm (RVD/Tpeak), estimation of mPAP from established formula (0.61·systolic PAP+2 mmHg, whereby *sPAP is obtained by continuous wave Doppler by tricuspid regurgitation (TR) peak velocity by Bernoulli + right atrial pressure), and echo pulmonary vascular resistance Tricuspid regurgitation peak velocity/[(RV outflow tract pulsed Doppler VTI × 10)+0.16]. The best discriminators for pulmonary hypertension (≥ 25 mmHg) and elevated pulmonary vascular resistance (>2WU) are shown in panel A and B, respectively. Area under the curve superscript (Citation1–Citation8): significant difference (p < 0.05) vs. numbered area under the curve.
![Figure 4. Comparative receiver operating characteristic curve analyses are presented in 50 patients (derivation group) for; heart rate adjusted pulmonary artery (HR-adjusted PAAcT), right ventricular (RV) systolic velocity time integral (HR-adjusted RVSmVTI), RV diameter (RVD)/time to peak Sm (RVD/Tpeak), estimation of mPAP from established formula (0.61·systolic PAP+2 mmHg, whereby *sPAP is obtained by continuous wave Doppler by tricuspid regurgitation (TR) peak velocity by Bernoulli + right atrial pressure), and echo pulmonary vascular resistance Tricuspid regurgitation peak velocity/[(RV outflow tract pulsed Doppler VTI × 10)+0.16]. The best discriminators for pulmonary hypertension (≥ 25 mmHg) and elevated pulmonary vascular resistance (>2WU) are shown in panel A and B, respectively. Area under the curve superscript (Citation1–Citation8): significant difference (p < 0.05) vs. numbered area under the curve.](/cms/asset/b821cc1c-581b-4b57-8f70-18349a6071e3/icop_a_1057275_f0004_c.jpg)
Table 3. Diagnostic performance of echocardiographic indices in predicting pulmonary hypertension and elevated PVR in the validation group (n = 50) with cutoff values from the derivation cohort (n = 50)