
Figures & data
Table 1. Number of patients and the the number of times sputum was examined in stable state and during exacerbation
Table 2. Frequency of subtype of bronchitis identified by sputum examinations during COPD exacerbation and stable COPD
Table 3. Frequency of type of any current exacerbations by type of previous exacerbation
Figure 1. The Kaplan-Meier estimates for the proportion of patients having future exacerbations of any type of bronchitis was lowest for patients with normal sputum and highest for patients with combined eosinophilic and neutrophilic type of bronchitis at first exacerbation. A likelihood ratio test of the null hypothesis that there is no difference between these estimates gives p = 0.4245. Note: Patients must have at least 2 assessments.
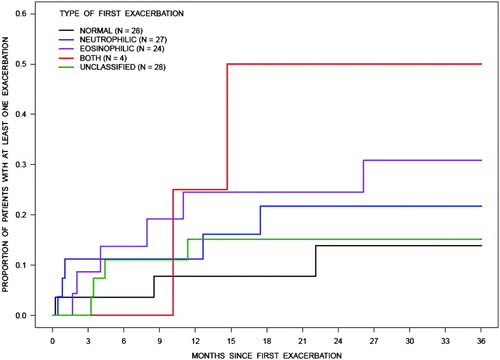
Figure 2. Among patients who had a specific (neutrophilic (N = 30) or eosinophilic (N = 26)) type of first exacerbation, the cumulative incidence functions for the proportion of patients who experienced another exacerbation by each subtype (neutrophilic, eosinophilic or other) of bronchitis up to 3 year for both groups were not significantly different.
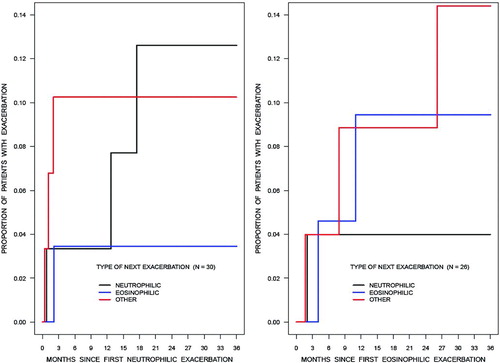
Table 4. Frequency of type of next exacerbation by type of previous assessment in clinically stable state
Figure 3. Among the assessments with a specific type of exacerbation, the cumulative incidence function for the probability of having a subsequent exacerbation was greater for neutrophilic bronchitis (left panel) than for eosinophilic bronchitis (right panel). Note: Patients must have at least 2 assessments.
Table 5. Andersen-Gill type model for gap times between kth exacerbation to (k +1)th exacerbation