
Figures & data
Table 1. Principal baseline characteristics of the 221 subjects at enrollment; 198 were on LTOT and 23 on LTOT+ HMV
Table 2. Baseline predictors of mortality: univariate approach
Figure 1. Survival curves of patients with chronic respiratory failure stratified for age; “More impaired” and “less impaired” subgroups were identified according to cut-off points of the ROC analysis. “More impaired” patients (dashed lines) presented a higher mortality than “less impaired” patients (continuous lines). P-value was calculated using the Log-Rank test. Older people (age > 67 yrs; n = 132) showed a trend in reduced survival; however, this was not statistically different with less older people (age ≤ 67 yr; n = 89), p = 0.178.
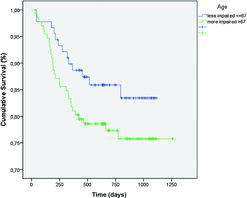
Figure 2. Survival curves of patients with chronic respiratory failure stratified for Oxygen flow at rest. “More impaired” and “less impaired” subgroups were identified according to cut-off points of the ROC analysis. “More impaired” patients (dashed lines) presented a higher mortality than “less impaired” patients (continuous lines). P-value was calculated using the Log-Rank test. Patients who used more than 1.75 L/min. of oxygen at rest (n = 112) had a higher mortality rate in comparison to patients who used less oxygen (≤1.75 L/min; n = 97), p = 0.001.
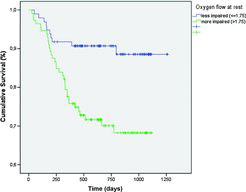
Figure 3. Survival curves of patients with chronic respiratory failure stratified for SGRQ total score. “More impaired” and “less impaired” subgroups were identified according to cut-off points of the ROC analysis. “More impaired” patients (dashed lines) presented a higher mortality than “less impaired” patients (continuous lines). P-value was calculated using the Log-Rank test. Patients with poorer health status (SGRQ Tot > 61.5; n = 76) had a higher mortality rate in comparison to patients who had a better health status (SGRQ Tot ≤ 61.5; n = 141), p = 0.001.
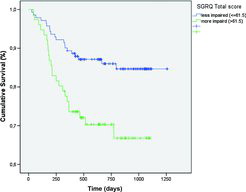
Figure 4. Survival curves of patients with chronic respiratory failure stratified for MRF26 total score. “More impaired” and “less impaired” subgroups were identified according to cut-off points of the ROC analysis. “More impaired” patients (dashed lines) presented a higher mortality than “less impaired” patients (continuous lines). P-value was calculated using the Log-Rank test. Patients with poorer health status (MRF-26 Tot > 40.4; n = 118) had a higher mortality rate in comparison to patients who had a better health status (MRF-26 Tot ≤ 40.4; n = 103), p = 0.019.
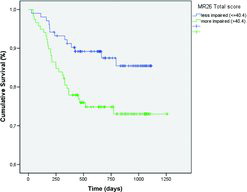
Table 3. Hazard ratios and 95% confidence intervals from Cox models for all-cause mortality