940
Views
16
CrossRef citations to date
0
Altmetric
Original Research

Mucosal-Associated Invariant T Cell Deficiency in Chronic Obstructive Pulmonary Disease

, , , , , , , , & show all

Figures & data

Table 1.  Clinical and laboratory characteristics of 45 COPD patients

Figure 1.  Reduced circulating mucosal-associated invariant T (MAIT) cell numbers in the peripheral blood samples of chronic obstructive pulmonary disease (COPD) patients. Freshly isolated peripheral blood mononuclear cells from 57 healthy controls (HCs) and 45 COPD patients were stained with allophycocyanin (APC)-Alexa Fluor 750-conjugated anti-CD3 and fluorescein isothiocyanate-conjugated anti-CD161 monoclonal antibodies and then analyzed by flow cytometry. Percentages of MAIT cells were calculated using a αβ T cell gate. (a) Representative MAIT cell percentages as determined by flow cytometry. (b) MAIT cell percentages among peripheral blood αβ T cells. (c) Absolute MAIT cell numbers (per microliter of blood). Symbols represent individual subjects and horizontal lines indicate median values. (d) MAIT cell subset percentages among peripheral blood αβ T cells. Data are shown as box plots. Each box represents the 25th and 75th percentiles. Lines inside the boxes represent the median. Whiskers represent the 10th and 90th percentiles. *p < 0.05, **p < 0.005.
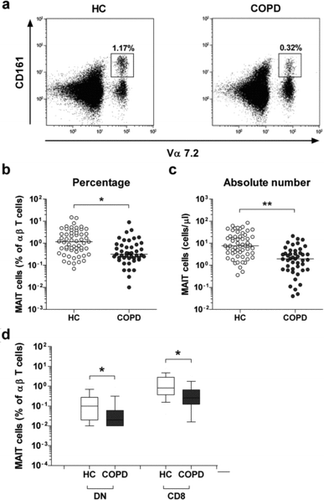
Figure 1.  Reduced circulating mucosal-associated invariant T (MAIT) cell numbers in the peripheral blood samples of chronic obstructive pulmonary disease (COPD) patients. Freshly isolated peripheral blood mononuclear cells from 57 healthy controls (HCs) and 45 COPD patients were stained with allophycocyanin (APC)-Alexa Fluor 750-conjugated anti-CD3 and fluorescein isothiocyanate-conjugated anti-CD161 monoclonal antibodies and then analyzed by flow cytometry. Percentages of MAIT cells were calculated using a αβ T cell gate. (a) Representative MAIT cell percentages as determined by flow cytometry. (b) MAIT cell percentages among peripheral blood αβ T cells. (c) Absolute MAIT cell numbers (per microliter of blood). Symbols represent individual subjects and horizontal lines indicate median values. (d) MAIT cell subset percentages among peripheral blood αβ T cells. Data are shown as box plots. Each box represents the 25th and 75th percentiles. Lines inside the boxes represent the median. Whiskers represent the 10th and 90th percentiles. *p < 0.05, **p < 0.005.

Table 2.  Regression coefficients for log-transformed percentage of MAIT cells with respect to clinical and laboratory parameters in the 45 COPD patients

Figure 2.  Reduced circulating mucosal-associated invariant T (MAIT) cell frequency in patients with advanced stage of chronic obstructive pulmonary disease (COPD). Freshly isolated peripheral blood mononuclear cells from 45 COPD patients were stained with allophycocyanin (APC)-Alexa Fluor 750-conjugated anti-CD3 and fluorescein isothiocyanate-conjugated anti-CD161 monoclonal antibodies and then analyzed by flow cytometry. According to the Global initiative for Chronic Obstructive Lung Disease (GOLD) grading system, the severity of COPD can be subclassified into GOLD 1 (mild), GOLD 2 (moderate), GOLD 3 (severe), and GOLD 4 (very severe). Percentages of MAIT cells were calculated using a αβ T cell gate. Symbols represent individual subjects and horizontal lines indicate median values. *p < 0.05.
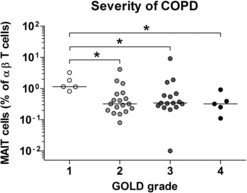
Figure 2.  Reduced circulating mucosal-associated invariant T (MAIT) cell frequency in patients with advanced stage of chronic obstructive pulmonary disease (COPD). Freshly isolated peripheral blood mononuclear cells from 45 COPD patients were stained with allophycocyanin (APC)-Alexa Fluor 750-conjugated anti-CD3 and fluorescein isothiocyanate-conjugated anti-CD161 monoclonal antibodies and then analyzed by flow cytometry. According to the Global initiative for Chronic Obstructive Lung Disease (GOLD) grading system, the severity of COPD can be subclassified into GOLD 1 (mild), GOLD 2 (moderate), GOLD 3 (severe), and GOLD 4 (very severe). Percentages of MAIT cells were calculated using a αβ T cell gate. Symbols represent individual subjects and horizontal lines indicate median values. *p < 0.05.
Supplemental material

ICOP_A_1069806_SUPP.doc

Download MS Word (310 KB)

Reprints and Corporate Permissions

Please note: Selecting permissions does not provide access to the full text of the article, please see our help page How do I view content?

To request a reprint or corporate permissions for this article, please click on the relevant link below:

Academic Permissions

Please note: Selecting permissions does not provide access to the full text of the article, please see our help page How do I view content?

Obtain permissions instantly via Rightslink by clicking on the button below:

If you are unable to obtain permissions via Rightslink, please complete and submit this Permissions form. For more information, please visit our Permissions help page.