
Figures & data
Table 1. Demographic and clinical characteristics of the subjects.
Figure 1. Levels of IL-32 (pg/ml) in BALF and IS from patients with COPD patients, asthma and healthy subjects. Data are shown as median (range). *P < 0.05, compared with patients with asthma #P < 0.05, compared with healthy subjects.
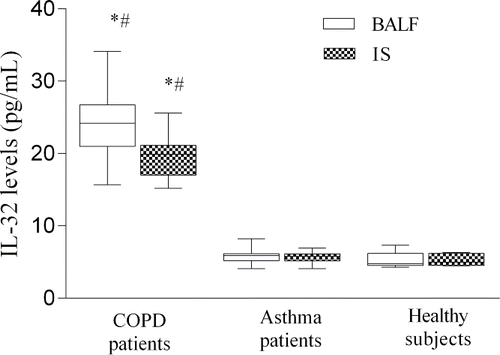
Table 2. Distribution of IL-32 concentration according to the smoking status.
Figure 2. Association between BAL fluid IL-32 levels and number of macrophages in patients with COPD (A) and asthma (B).
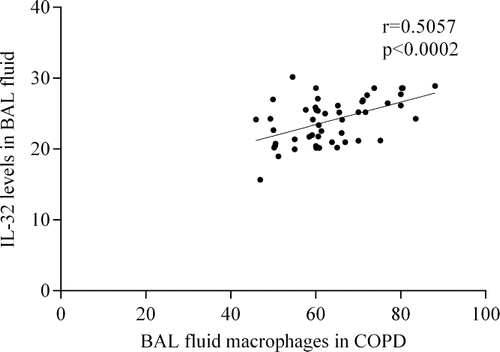
Table 3. Differential cell counts in IS supernatant and BAL fluid.