Figures & data
Table 1. Clinical, resting functional, and CPET responses for the whole sample and for patients separated by mortality status.
Figure 1. Receiver operating characteristics curve analyses contrasting lung function and exercise variables performance in predicting all-cause and respiratory mortality in patients with COPD. Best cut-offs for individual variables are marked by circles and shown in and , respectively. p < 0.05: * vs. FEV1, TLC, and TLCO/VA (lung function) and vs. O2 pulse, HR, and SpO2 (exercise). Abbreviations: COPD = chronic obstructive pulmonary disease; AUC = area under the curve; CI = confidence interval; IC = inspiratory capacity; TLC = total lung capacity; RV = residual volume; FEV1 = forced expiratory volume in one second; TLCO = transfer factor; VO2 = oxygen uptake; VE = minute ventilation; VCO2 = carbon dioxide output; HR = heart rate; SpO2 = oxy-hemoglobin saturation by pulse oximetry.
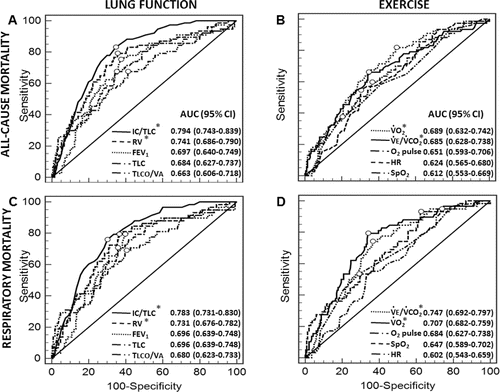
Table 2. All-cause mortality prediction: performance of optimal thresholds for individual lung function and exercise variables.
Table 3. Respiratory mortality prediction: performance of optimal thresholds for individual lung function and exercise variables.
Table 4. All-cause mortality prediction: univariate and multivariate logistic regression modeling.
Table 5. Respiratory mortality prediction: univariate and multivariate logistic regression modeling.
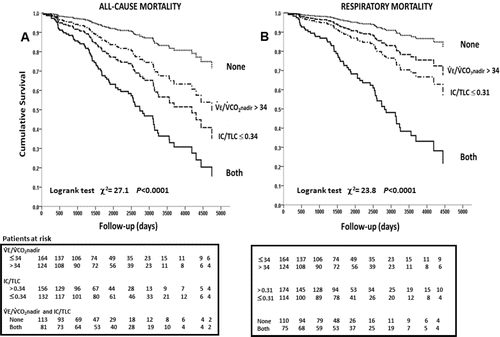
Figure 2. Kaplan–Meyer survival curves for resting IC/TLC and VE/VCO2 nadir optimal thresholds as defined by receiver operating characteristics curve analyses. Abbreviations: IC = inspiratory capacity; TLC = total lung capacity; VE = exercise ventilation; VCO2 = CO2 output.