Figures & data
Figure 1. Schematic diagram illustrating the TM4-Cx43CT construct. The TM4-Cx43CT is colored black and the soluble Cx43CT construct is highlighted in the gray box. The abbreviations are as follows: NT, amino-terminus; CL, cytoplasmic loop; CT, carboxyl-terminus; EL1 and EL2, extracellular loops 1 and 2; 1–4, transmembrane domains 1–4.
Figure 2. Circular dichroism (CD) profile of the soluble Cx43CT and the TM4-Cx43CT. (A) CD spectra demonstrating the structural responsiveness of the soluble Cx43CT (gray) and the TM4-Cx43CT (black) to changes in pH. (B) Spectral profile of the TM4-Cx43CT in MES buffer (pH 5.8, 50 mM NaCl, 42°C) solubilized in LPPG (solid black line), LSPG (dotted black line), LPPC (solid gray line), and DPC (dotted gray line) micelles.
Figure 3. 15N-HSQC spectra of the TM4-Cx43CT in different detergent micelles. The TM4-Cx43CT was solubilized in MES buffer (pH 5.8, 50 mM NaCl, 42°C) with (A) LPPG, (B) LPPC, (C) LSPG, and (D) DPC detergent micelles. Spectral quality was determined by the number of observed peaks versus the number of expected peaks. Peak counts are given in the top right corner of each spectrum as observed/expected.
Figure 4. Circular dichroism (CD) profile of the TM4-Cx43CT in various buffers. Spectra the TM4-Cx43CT solubilized in LPPG detergent micelles in MES buffer (pH 5.8, 50 mM NaCl, 42°C) (black), a low-salt MES buffer (pH 5.8, 10 mM NaCl, 42°C) (red), and potassium phosphate buffer (pH 5.8, 42°C) (blue). (A) CD spectra of the TM4-Cx43CT. (B) 15N-HSQC spectra of the TM4-Cx43CT. In each of the buffers, 143 peaks out of expected 199 peaks were observed.
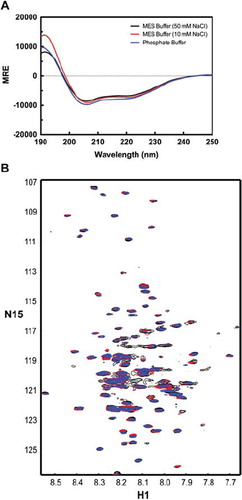
Figure 5. Spectra of the TM4-Cx43CT in TFE. TM4-Cx43CT solubilized in LPPG micelles (MES buffer, pH 5.8, 50 mM NaCl, 42°C) titrated with 0% (black) 5% (red), 10% (green), and 30% (blue) TFE. (A) CD spectra collected for the TM4-Cx43CT TFE titration. (B) Overlay of the NMR spectra collected for the TM4-Cx43CT titrated with TFE. (C–F) Close-up view of each spectrum (black rectangle from A).
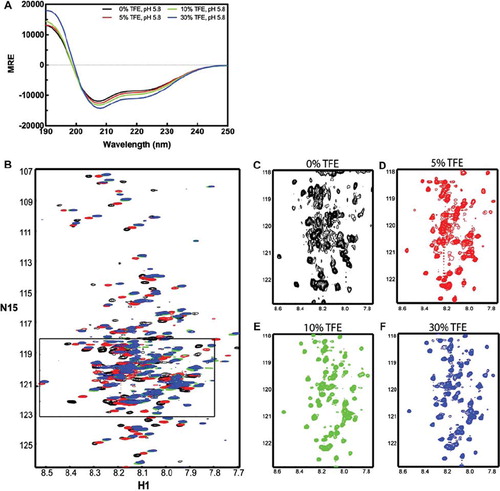
Figure 6. Circular dichroism (CD) profile of the TM4-Cx43CTΔEL2. CD spectra of the TM4-Cx43CTΔEL2 solubilized in LPPG micelles (MES buffer pH 5.8, 50 mM NaCl, 42°C). (A) CD spectra comparing the secondary structure of the TM4-Cx43CTΔEL2 at pH 7.5 (solid black line) to pH 5.8 (dotted black line) and to pH 5.8 and 10% TFE (solid gray line). (B) CD spectra for the TM4-Cx43CTΔEL titrated with 0% (solid black line), 10% (dotted black line), 30% (solid gray line), and 50% (dotted gray line).
Figure 7. 15N-HSQC spectra of the TM4-Cx43CTΔEL2 solubilized in LPPG micelles. (A) TM4-Cx43CTΔEL2 spectrum collected under conditions optimized for the TM4-Cx43CT (MES buffer [pH 5.8], 8% LPPG, 42°C). (B) Spectrum of the TM4-Cx43CTΔEL2 in the buffer from A plus 10% TFE. Observed versus expected peaks are given in the top right corner of each of the spectra.
![Figure 7. 15N-HSQC spectra of the TM4-Cx43CTΔEL2 solubilized in LPPG micelles. (A) TM4-Cx43CTΔEL2 spectrum collected under conditions optimized for the TM4-Cx43CT (MES buffer [pH 5.8], 8% LPPG, 42°C). (B) Spectrum of the TM4-Cx43CTΔEL2 in the buffer from A plus 10% TFE. Observed versus expected peaks are given in the top right corner of each of the spectra.](/cms/asset/cc14866f-cf2f-44a0-8fe7-97c453ac9a49/icac_a_487956_f0007_b.gif)
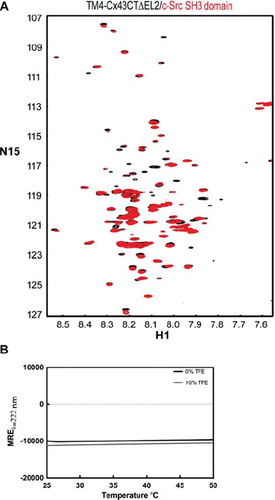
Figure 8. Effects of temperature on native binding interactions and secondary structure of the TM4-Cx43CTΔEL2. (A) Overlay of 15N-HSQC spectra of TM4Cx43CTΔEL2 solubilized in LPPG micelles (MES buffer, pH 5.8, 50 mM NaCl, 42°C) alone (black) and in the presence of c-Src SH3 domain (red), a known binding partner of Cx43. (B) CD spectra of the TM4Cx43CTΔEL2 solubilized in LPPG micelles (MES buffer, pH 5.8, 50 mM NaCl) (black line) and with the addition of 10% TFE (gray line) collected at 222 nm to monitor the change in helical content as a function of temperature.