2,631
Views
42
CrossRef citations to date
0
Altmetric
Review Article

Plakophilins in Desmosomal Adhesion and Signaling

, &
Pages 25-42 | Received 11 Dec 2013, Accepted 11 Dec 2013, Published online: 24 Jan 2014

Figures & data

Figure 1. Sequence conservation of PKPs.

Phylogenetic analysis of the PKPs is based on cDNA-sequences of the respective coding sequences (CDS) or 3´-UTR. The phylogenetic tree was created using the “One click” mode of the Phylogeny.fr platform (CitationCastresana, 2000; CitationGuindon and Gascuel, 2003; CitationEdgar, 2004; CitationAnisimova and Gascuel, 2006; CitationChevenet et al., 2006; CitationDereeper et al., 2008; CitationDereeper et al., 2010). The length of the horizontal connections correlates with the degree of nucleotide substitution.

Figure 1. Sequence conservation of PKPs.Phylogenetic analysis of the PKPs is based on cDNA-sequences of the respective coding sequences (CDS) or 3´-UTR. The phylogenetic tree was created using the “One click” mode of the Phylogeny.fr platform (CitationCastresana, 2000; CitationGuindon and Gascuel, 2003; CitationEdgar, 2004; CitationAnisimova and Gascuel, 2006; CitationChevenet et al., 2006; CitationDereeper et al., 2008; CitationDereeper et al., 2010). The length of the horizontal connections correlates with the degree of nucleotide substitution.

Figure 2. Regulation and functions of PKPs1–3.

Figure 2. Regulation and functions of PKPs1–3.

Figure 3. Changes in PKP expression in various tumors.

The NextBio Disease Atlas (CitationKupershmidt et al., 2010) was used to identify studies showing significantly altered expression of the PKPs in various cancers compared to the corresponding normal tissues. Red bars correspond to the number of studies showing up-regulation, green bars indicate the number of studies showing a down-regulation of PKP-mRNA levels.

Figure 3. Changes in PKP expression in various tumors.The NextBio Disease Atlas (CitationKupershmidt et al., 2010) was used to identify studies showing significantly altered expression of the PKPs in various cancers compared to the corresponding normal tissues. Red bars correspond to the number of studies showing up-regulation, green bars indicate the number of studies showing a down-regulation of PKP-mRNA levels.

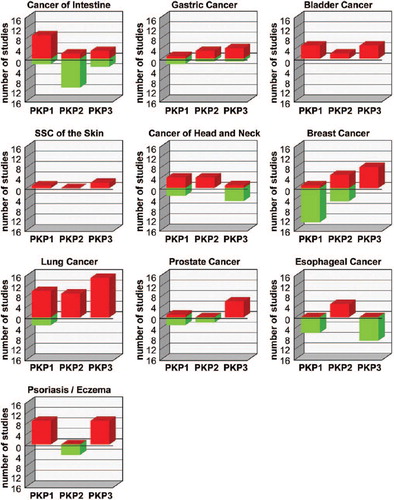
Table 1. PKP expression in cancer.

Figure 4. Regulation of PKP1 function by insulin/IGF-1-signaling.

Figure 4. Regulation of PKP1 function by insulin/IGF-1-signaling.

Reprints and Corporate Permissions

Please note: Selecting permissions does not provide access to the full text of the article, please see our help page How do I view content?

To request a reprint or corporate permissions for this article, please click on the relevant link below:

Academic Permissions

Please note: Selecting permissions does not provide access to the full text of the article, please see our help page How do I view content?

Obtain permissions instantly via Rightslink by clicking on the button below:

If you are unable to obtain permissions via Rightslink, please complete and submit this Permissions form. For more information, please visit our Permissions help page.