Figures & data
Figure 1. Diagram showing the distributions of the major desmosomal components and their isoforms in human epidermis. In the cornified layer, desmosomal adhesion is mediated by corneodesmosin, which is not discussed in this review.
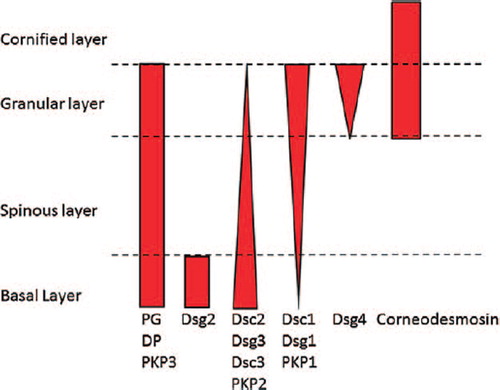
Figure 2. Stick diagrams of the DCs, Dsc2 and Dsg2, showing features referred to in text. EC, extracellular; EA, extracellular anchor; TM, transmembrane; ICS, intracellular cadherin segment; IPL, intracellular proline-rich linker; RUD, repeat unit domain; TD, terminal domain.
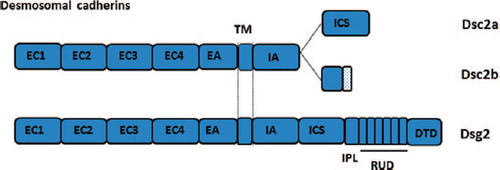
Figure 3. Graph showing reciprocal exponential distributions of Dsc1 and Dsc3 in bovine nasal epidermis as determined by quantitative analysis of immuno-gold labelling (CitationNorth et al., 1996).
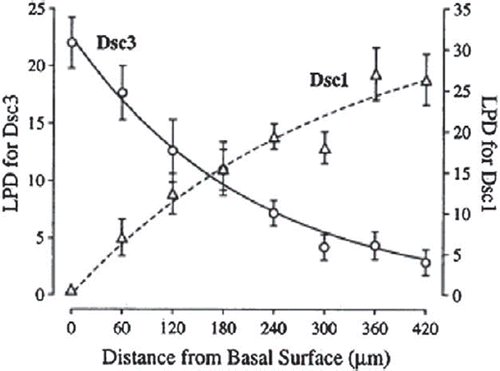
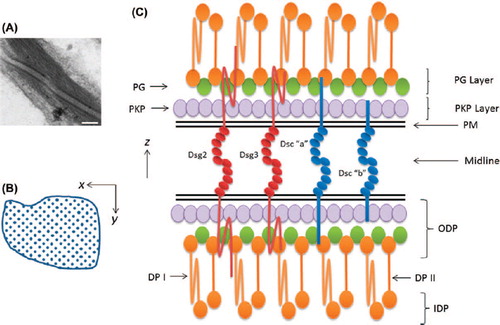
Figure 4. Desmosome structure. Electron micrograph of two desmosomes from human chronic wound epidermis showing the midline between the plasma membranes, the outer dense plaques and the inner dense plaques with attached keratin filaments (bar = 100 nm). Diagram showing the quadratic array of DCs the intercellular region. This had a periodicity of ˜70Å. Diagram (not to scale) showing transverse lamellar arrangement of desmosome. The locations of the molecules are based on immuno-gold labelling and electron tomography (See text).