Figures & data
Table 1. Primers used for real time PCR detection.
Figure 1. Macrophage co-culture aggravated gene expressions in hypoxia-stimulated HCMECs. The gene mRNAs were measured by real-time RT-PCR. (A) The changes of HIF-1α, HIF-2α and VEGF in control (Con), hypoxia (Hx), hypoxia plus macrophage co-culture (Hx + Mϕ) and macrophage co-culture (Mϕ) groups. (B) The changes of eNOS, iNOS and ECE-1 in Con, Hx, Hx + Mϕ and Mϕ groups. (C) The changes of COX-2 and PGIS in Con, Hx, Hx + Mϕ and Mϕ groups. **p < 0.01 or *p < 0.05, versus Con group. ##p < 0.01 or #p < 0.05, versus Hx group. (D) The time-dependent expression of iNOS in hypoxia-activated macrophages. **p < 0.01 or *p < 0.05, versus 0 h group. The data were repeated three times and represented as mean ± SD.
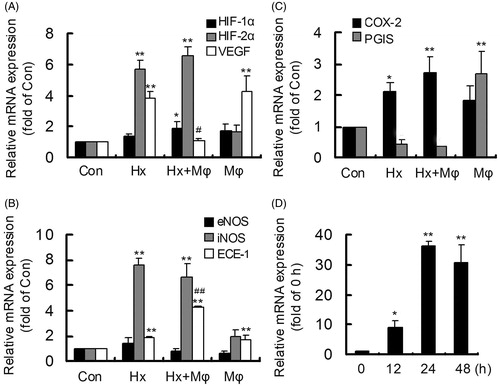
Figure 2. Gene expression of HIF-1α, HIF-2α and VEGF in treated HCMECs. **p < 0.01, versus Con group; ##p < 0.01 or #p < 0.05, versus Hx + Mϕ group; ††p < 0.01, versus Hx + Mϕ+ FeTPPS group. The data were repeated three times and represented as mean ± SD. Con, control; Hx + Mϕ, hypoxia plus macrophage co-culture; LT, low dose TXL; MT, middle dose TXL; HT, high dose TXL.
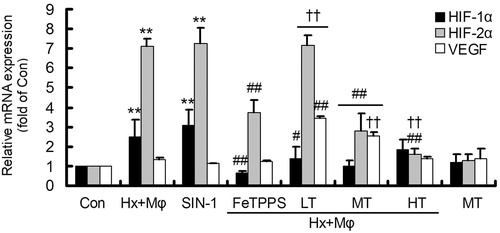
Figure 3. Gene expression of eNOS, iNOS and ECE-1 in treated HCMECs. **p < 0.01, versus Con group; ##p < 0.01 or #p < 0.05, versus Hx + Mϕ group; ††p < 0.01, versus Hx + Mϕ + FeTPPS group. The data were repeated three times and represented as mean ± SD. Con, control; Hx + Mϕ, hypoxia plus macrophage co-culture; LT, low dose TXL; MT, middle dose TXL; HT, high dose TXL.
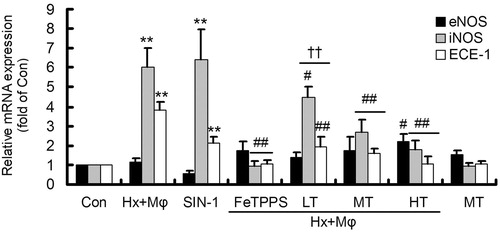
Figure 4. Gene expression of COX-2 and PGIS in treated HCMECs. **p < 0.01, versus Con group; ##p < 0.01 or #p < 0.05, versus Hx + Mϕ group; ††p < 0.01, versus Hx + Mϕ + FeTPPS group. The data were repeated three times and represented as mean ± SD. Con, control; Hx + Mϕ, hypoxia plus macrophage co-culture; LT, low dose TXL; MT, middle dose TXL; HT, high dose TXL.
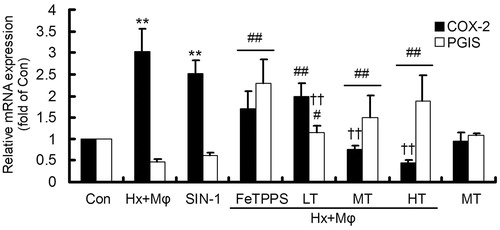
Figure 5. Protein levels of the remarkably altered genes in treated HCMECs. (A) Protein levels were detected by western blotting. (B) The changes of HIF-2α and VEGF in control (Con), hypoxia plus macrophage co-culture (Hx + Mϕ), SIN-1, Hx + Mϕ + FeTPPS and Hx + Mϕ + MT groups. (C) The changes of iNOS and ECE-1 in Con, Hx + Mϕ, SIN-1, Hx + Mϕ + FeTPPS and Hx + Mϕ + MT groups. (D) The changes of COX-2 and PGIS in Con, Hx + Mϕ, SIN-1, Hx + Mϕ + FeTPPS and Hx + Mϕ + MT groups. **p < 0.01 or *p < 0.05, versus Con group; ##p < 0.01 or #p < 0.05, versus Hx + Mϕ group. The data were repeated three times and represented as mean ± SD. MT, middle dose TXL.
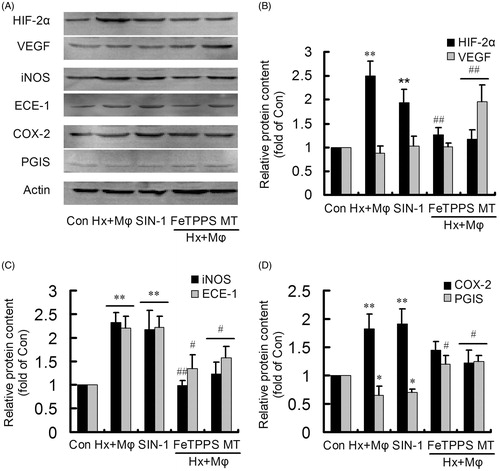
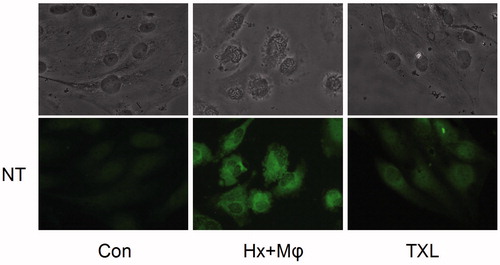
Figure 6. TXL inhibited nitrotyrosine formation to attenuate HCMEC injury (400×). The nitrotyrosine content was evaluated by immunofluorescence. The upper ones were HCMEC morphological alterations and the lower showed nitrotyrosine fluorescence. Con, control; Hx + Mϕ, hypoxia plus macrophage co-culture; MT, middle dose TXL.