Figures & data
Figure 1. PTPρ deletion constructs are all expressed at the cell surface. Constructs containing deletions of one extracellular domain of PTPρ each were generated and expressed in Sf9 cells. Total cellular protein and cell surface protein were isolated and immunoblotted with the SK18 antibody.
Figure 2. Deletion of any of the extracellular domains of PTPρ disrupts cell-cell aggregation. Sf9 cells expressing deletion constructs of the individual extracellular domains of PTPρ were allowed to aggregate for 30 minutes prior to imaging. Scale bar equals 100 μm. The percentage of Sf9 cell-cell aggregation for each deletion protein was calculated from a minimum of three experiments. An asterisk indicates a statistically significant reduction in aggregation (p < .005).
Figure 3. PTPρ proteins containing tumor-derived mutations in their FNIII domains are expressed at the cell surface. Ten mutations in the FNIII domains of PTPρ were generated by site-directed mutagenesis and expressed in Sf9 cells. Total cellular and cell surface proteins were isolated and analyzed by immunoblotting with the SK18 antibody.
Figure 4. Tumor derived mutations in FNIII domains of PTPρ are defective in cell-cell aggregation. Sf9 cells expressing the mutated PTPρ proteins were allowed to aggregate for 30 min prior to imaging. Scale bar equals 100 μm. The percentage of Sf9 cell-cell aggregation for each mutant protein was calculated from a minimum of three experiments. An asterisk indicates a statistically significant reduction in aggregation (p < .008).
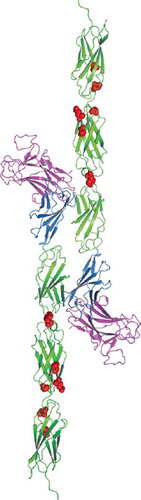
Figure 5. Homology model of tumor derived point mutations of PTPρ. The MAM domain (Magenta), Ig domain (Blue) and FNIII repeats (Green) and point mutations (Red) evaluated in this work were modeled onto the equivalent sites in the crystal structure of PTPμ (PDB ID: 2V5Y. The PTPρ mutations likely alter cell-cell aggregation either by altering the three-dimensional topology and/or cis/trans interactions of PTPρ.