954
Views
36
CrossRef citations to date
0
Altmetric
Research Article

Immunosuppressive effects of triclosan, nonylphenol, and DDT on human natural killer cells in vitro

, , &
Pages 205-212 | Received 21 Oct 2009, Accepted 01 Feb 2010, Published online: 18 Mar 2010

Figures & data

Figure 1. Effects of triclosan (TC) exposures on the ability of natural killer (NK) cells to lyse tumor cells. NK cells were exposed to 0.5 – 10 µM TC for 1 h, 24 h, 48 h, or 6 days. To combine results from separate experiments (using cells from different donors) the levels of lysis were normalized as the percentage of the lytic function of the control cells in a given experiment. Results were from three separate experiments using different donors (triplicate determinations for each experiment; n = 9, mean ± SD). *Statistically significant change as compared to control cells at that same length of incubation (P < 0.05).
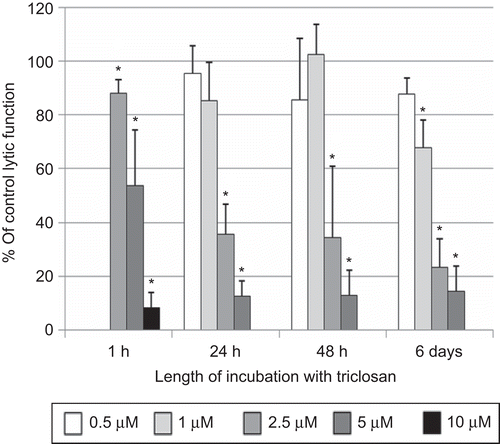
Figure 1.  Effects of triclosan (TC) exposures on the ability of natural killer (NK) cells to lyse tumor cells. NK cells were exposed to 0.5 – 10 µM TC for 1 h, 24 h, 48 h, or 6 days. To combine results from separate experiments (using cells from different donors) the levels of lysis were normalized as the percentage of the lytic function of the control cells in a given experiment. Results were from three separate experiments using different donors (triplicate determinations for each experiment; n = 9, mean ± SD). *Statistically significant change as compared to control cells at that same length of incubation (P < 0.05).
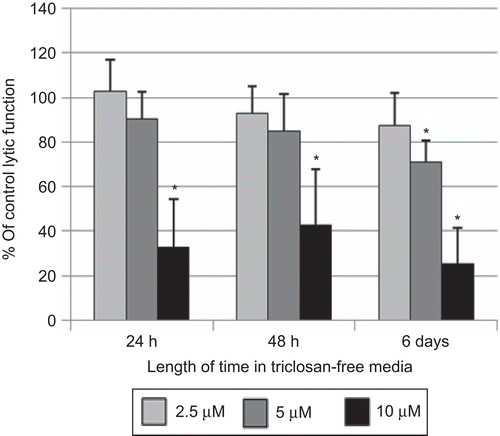
Figure 2. Effects of 1-h exposures to triclosan (TC) followed by 24 h, 48 h, or 6 days in TC-free media on the ability of natural killer (NK) cells to lyse tumor cells. NK cells were exposed to 2.5–10 µM TC for 1 h. Results were from at least three separate experiments using different donors (triplicate determinations for each experiment; n = 9, mean ± SD), as described in . *Statistically significant change as compared to control cells at that same length of incubation (P < 0.05).
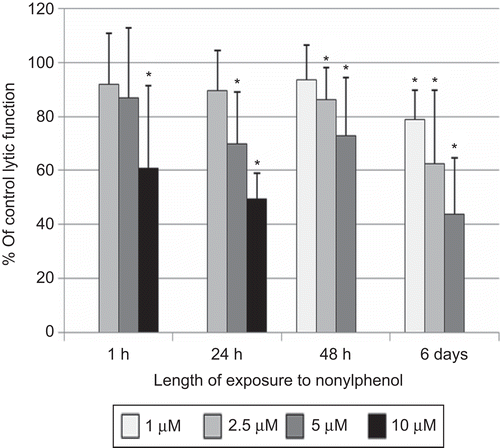
Figure 2.  Effects of 1-h exposures to triclosan (TC) followed by 24 h, 48 h, or 6 days in TC-free media on the ability of natural killer (NK) cells to lyse tumor cells. NK cells were exposed to 2.5–10 µM TC for 1 h. Results were from at least three separate experiments using different donors (triplicate determinations for each experiment; n = 9, mean ± SD), as described in Figure 1. *Statistically significant change as compared to control cells at that same length of incubation (P < 0.05).
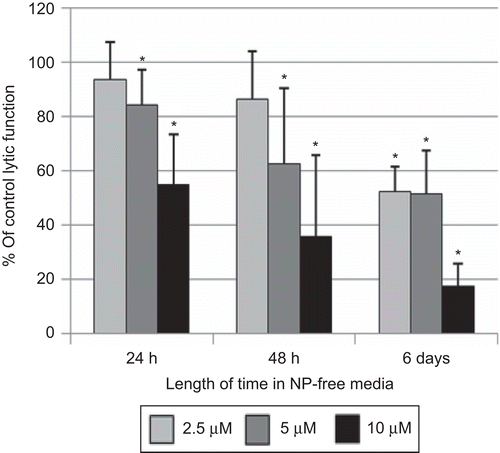
Figure 3. Effects of nonylphenol (NP) exposures on the ability of natural killer (NK) cells to lyse tumor cells. NK cells were exposed to 1–10 µM NP for 1 h, 24 h, 48 h, or 6 days. Results were from three separate experiments using different donors (triplicate determinations for each experiment, n = 9, mean ± SD), as described in . *Statistically significant change as compared to control cells at that same length of incubation (P < 0.05).
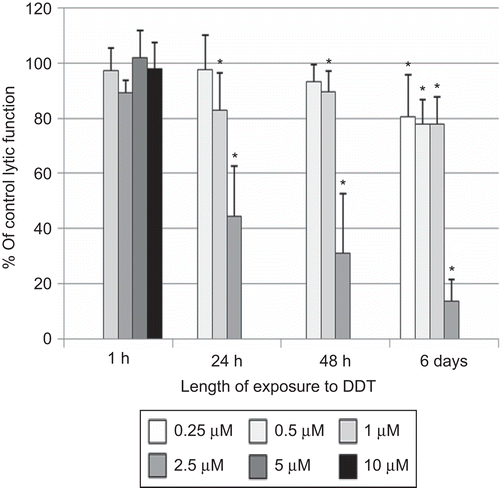
Figure 3.  Effects of nonylphenol (NP) exposures on the ability of natural killer (NK) cells to lyse tumor cells. NK cells were exposed to 1–10 µM NP for 1 h, 24 h, 48 h, or 6 days. Results were from three separate experiments using different donors (triplicate determinations for each experiment, n = 9, mean ± SD), as described in Figure 1. *Statistically significant change as compared to control cells at that same length of incubation (P < 0.05).
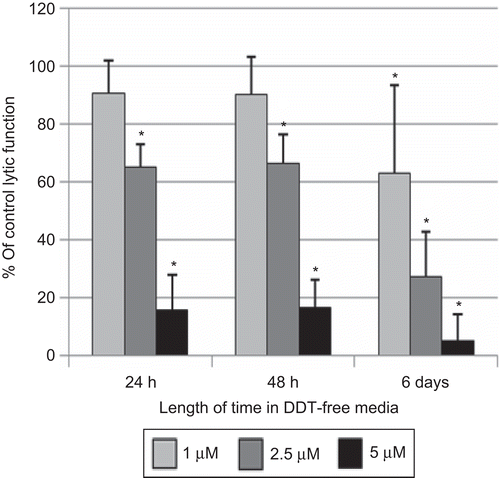
Figure 4. Effects of 1-h exposures to nonylphenol (NP) followed by 24 h, 48 h, or 6 days in NP-free media on the ability of natural killer (NK) cells to lyse tumor cells. NK cells were exposed to 2.5–10 µM NP for 1 h. Results were from at least three separate experiments using different donors (triplicate determinations for each experiment; n = 9, mean ± SD), as described in . *Statistically significant change as compared to control cells at that same length of incubation (P < 0.05).

Figure 4.  Effects of 1-h exposures to nonylphenol (NP) followed by 24 h, 48 h, or 6 days in NP-free media on the ability of natural killer (NK) cells to lyse tumor cells. NK cells were exposed to 2.5–10 µM NP for 1 h. Results were from at least three separate experiments using different donors (triplicate determinations for each experiment; n = 9, mean ± SD), as described in Figure 1. *Statistically significant change as compared to control cells at that same length of incubation (P < 0.05).

Figure 5. Effects of DDT exposures on the ability of natural killer (NK) cells to lyse tumor cells. NK cells were exposed to 0.25–10 µM DDT for 1 h, 24 h, 48 h, or 6 days. Results were from three separate experiments using different donors (triplicate determinations for each experiment; n = 9, mean ± SD), as described in . *Statistically significant change as compared to control cells at that same length of incubation (P < 0.05).

Figure 5.  Effects of DDT exposures on the ability of natural killer (NK) cells to lyse tumor cells. NK cells were exposed to 0.25–10 µM DDT for 1 h, 24 h, 48 h, or 6 days. Results were from three separate experiments using different donors (triplicate determinations for each experiment; n = 9, mean ± SD), as described in Figure 1. *Statistically significant change as compared to control cells at that same length of incubation (P < 0.05).

Figure 6. Effects of 1 h exposures to DDT followed by 24 h, 48 h, or 6 days in DDT-free media on the ability of natural killer (NK) cells to lyse tumor cells. NK cells were exposed to 1–5 µM DDT for 1 h. Results were from at least three separate experiments using different donors (triplicate determinations for each experiment; n = 9, mean ± SD), as described in . *Statistically significant change as compared to control cells at that same length of incubation (P < 0.05).

Figure 6.  Effects of 1 h exposures to DDT followed by 24 h, 48 h, or 6 days in DDT-free media on the ability of natural killer (NK) cells to lyse tumor cells. NK cells were exposed to 1–5 µM DDT for 1 h. Results were from at least three separate experiments using different donors (triplicate determinations for each experiment; n = 9, mean ± SD), as described in Figure 1. *Statistically significant change as compared to control cells at that same length of incubation (P < 0.05).

Reprints and Corporate Permissions

Please note: Selecting permissions does not provide access to the full text of the article, please see our help page How do I view content?

To request a reprint or corporate permissions for this article, please click on the relevant link below:

Academic Permissions

Please note: Selecting permissions does not provide access to the full text of the article, please see our help page How do I view content?

Obtain permissions instantly via Rightslink by clicking on the button below:

If you are unable to obtain permissions via Rightslink, please complete and submit this Permissions form. For more information, please visit our Permissions help page.