Figures & data
Table 1. Chemical doses used.
Figure 1. Annexin-V (A: Jurkat T-cells; D: EL4 cells) and caspase-3 (B: Jurkat T-cells; E: EL4 cells) expression, and amount of DNA fragmentation (C: Jurkat T-cells; F: EL4 cells) in cells treated with parathion and methoxychlor. Annexin-V and caspase-3 expression values are expressed as mean (%) ± SD (n = 4 per group). Statistical significance indicated by asterisks: *p < 0.05 and **p < 0.01 compared with the control value (Dunnett’s multiple comparison test); Φp < .05 and ΦΦp < 0.01 compared with the high-dose treatment group (Dunnett’s multiple comparison test). For DNA fragmentation, molecular weight markers are shown on the left in C and F.
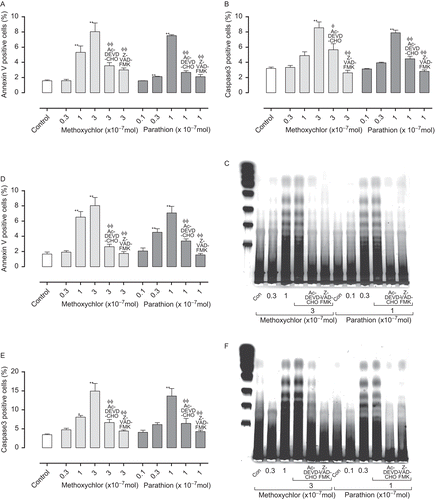
Figure 2. Incorporation of [3H]-TdR in auricular lymph node in (A) TMA pre-treated with parathion, (B) DNCB pre-treated with parathion, (C) TMA pre-treated with methoxychlor, and (D) DNCB pre-treated with methoxychlor, in local lymph node assay. Incorporation of [3H]-TdR values are expressed as mean (dpm) ± SD (n = 5 per group). Statistical significance indicated by asterisks: *p < 0.05, **p < 0.01 compared with the vehicle control group (Dunnett’s multiple comparison test). DNCB, 2,4-dinitrochlorobenzene; TMA, trimellitic anhydride. [3H]-TdR, [3H]-methyl thymidine
![Figure 2. Incorporation of [3H]-TdR in auricular lymph node in (A) TMA pre-treated with parathion, (B) DNCB pre-treated with parathion, (C) TMA pre-treated with methoxychlor, and (D) DNCB pre-treated with methoxychlor, in local lymph node assay. Incorporation of [3H]-TdR values are expressed as mean (dpm) ± SD (n = 5 per group). Statistical significance indicated by asterisks: *p < 0.05, **p < 0.01 compared with the vehicle control group (Dunnett’s multiple comparison test). DNCB, 2,4-dinitrochlorobenzene; TMA, trimellitic anhydride. [3H]-TdR, [3H]-methyl thymidine](/cms/asset/9ed0441c-5716-47ad-a22e-9285fc6c17cf/iimt_a_566231_f0002_b.gif)
Figure 3. Helper (CD4+CD8−) (A: parathion; B: methoxychlor) and cytotoxic (CD4−CD8+) (C: Parathion; D: Methoxychlor) T-lymphocyte counts in auricular lymph nodes of mice treated with test solution. Helper- and cytotoxic T-lymphocyte counts are expressed as mean (× 105 cells) ± SD (n = 6 per group). Statistical significance indicated by asterisks: *p < 0.05, **p < 0.01 compared with the vehicle control group (Dunnett’s multiple comparison test). AOO, acetone + olive oil, DNCB, 2,4-dinitrochlorobenzene; TMA, trimellitic anhydride.
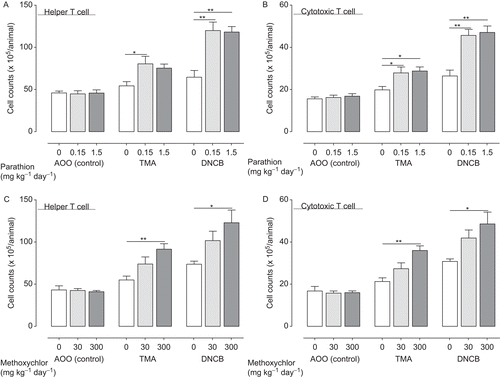
Figure 4. TH1 cytokine production (IFNγ (A: parathion; D: methoxychlor), TNFα (B: Parathion; E: Methoxychlor), IL-17 (C: parathion; F: methoxychlor)) in auricular lymph nodes of mice treated with test solution. TH1 cytokine production values are expressed as mean (pg/ mL) ± SD (n = 6 per group). Statistical significance is indicated by asterisks: *p < 0.05, **p < 0.01 compared with the vehicle control group (Dunnett’s multiple comparison test). AOO, acetone + olive oil; IFNγ, interferon-γ; IL, interleukin; TMA, trimellitic anhydride; DNCB, 2,4-dinitrochlorobenzene; TNFα, tumor necrosis factor-α.
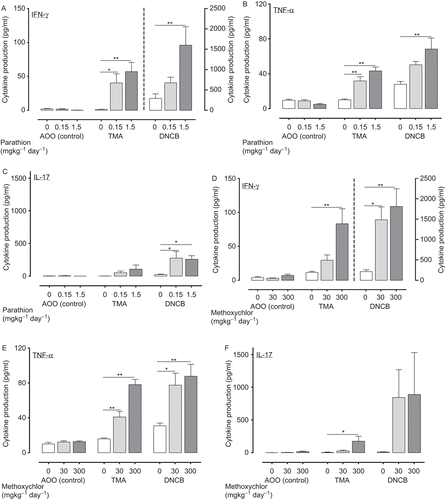
Figure 5. TH2 cytokine production (IL-4 (A: parathion; D: methoxychlor), IL-5 (B: parathion; E: methoxychlor), IL-13 (C: parathion; F: methoxychlor)) in auricular lymph nodes of mice treated with test solution. TH2 cytokine production values are expressed as mean (pg/mL) ± SD (n = 6 per group). Statistical significance is indicated by asterisks: *p < 0.05, **p < 0.01 compared with the vehicle control group (Dunnett’s multiple comparison test). AOO, acetone + olive oil; DNCB, 2,4-dinitrochlorobenzene; IL, interleukin; TMA, trimellitic anhydride.
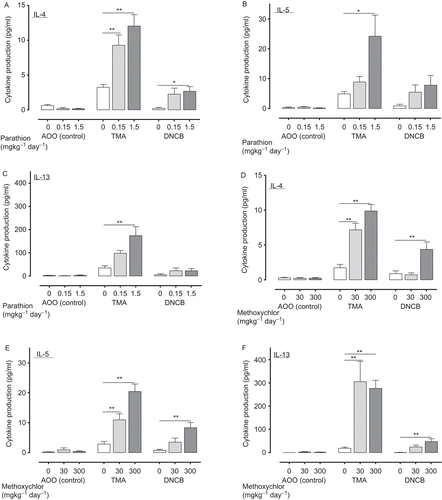
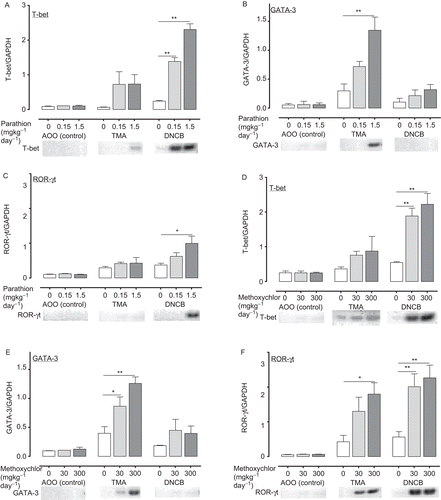
Figure 6. Expression of genes (T-bet (A: parathion; D: methoxychlor), GATA-3 (B: parathion; E: methoxychlor), ROR-γt (C: parathion; F: methoxychlor)) in auricular lymph nodes of mice treated with test solution. Gene expression values are represented the increase in expression compared to the value for the expression of GAPDH, and are expressed as mean ± SD (n = 6 per group). Statistical significance indicated by asterisks: *p < 0.05, **p < 0.01 compared with the vehicle control group (Dunnett’s multiple comparison test). PCR bands in photographs of the gels were visualized with a fluoroimager (Ettan DIGE) with 32, 35, and 35 amplification cycles for T-bet, ROR-γt and GATA-3, respectively. AOO, acetone + olive oil; DNCB, 2,4-dinitrochlorobenzene; GAPDH, glyceraldehyde-3-phosphate dehydrogenase; GATA 3, GATA binding protein 3; PCR, polymerase chain reaction; ROR-γt, retinoic acid-related orphan receptor-γt; T-bet, T-box expressed in T-cells; TMA, trimellitic anhydride.
