7,405
Views
4
CrossRef citations to date
0
Altmetric
Research Article

Bresol inhibits phosphodiesterase 4 gene expression and modulates the levels of select mediators of inflammation in human monocytic cells

, , , &
Pages 315-323 | Received 16 Feb 2011, Accepted 03 Jul 2011, Published online: 19 Aug 2011

Figures & data

Table 1.  List of primers used.

Figure 1.  Cytotoxicity of bresol on U937 monocytic cells. U937 cells were incubated for 24 h with different concentrations of bresol and the cell viability was then determined using an MTT assay. Data are expressed as mean (± SE) cytotoxicity (i.e., percentage reduction in viable cell numbers vs. viability level in control cultures). N = 3 samples/bresol concentration.
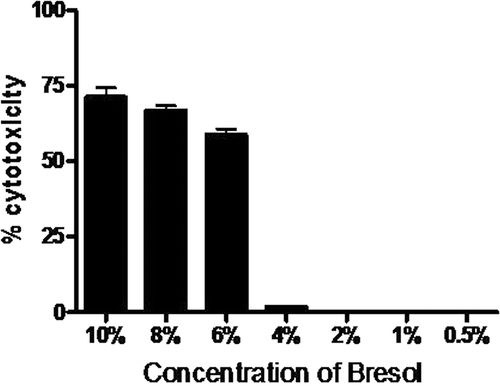
Figure 1.  Cytotoxicity of bresol on U937 monocytic cells. U937 cells were incubated for 24 h with different concentrations of bresol and the cell viability was then determined using an MTT assay. Data are expressed as mean (± SE) cytotoxicity (i.e., percentage reduction in viable cell numbers vs. viability level in control cultures). N = 3 samples/bresol concentration.

Figure 2.  Effect of bresol on phosphodiesterase 4B (PDE4B) gene expression in U937 cells. (A) Cells were treated with 0.1 µg LPS/ml alone, bresol (4%) alone, 0.1 µg LPS/ml + bresol (at indicated concentrations), rolipram (30 µM) + 0.1 µg LPS/ml, or vehicle only for 24 h. RNA was then isolated from the cultures and RT-PCR carried out using oligo-dT primers and PDE4B-specific primers as described in the Methods. The image shown is a representative from among three replicates. Expression of the housekeeping GAPDH gene is included here to demonstrate loading equality. (B) Densitometric analysis of gene transcripts. The relative level of PDE4B gene expression is normalized to GAPDH. Values shown depict arbitrary units.
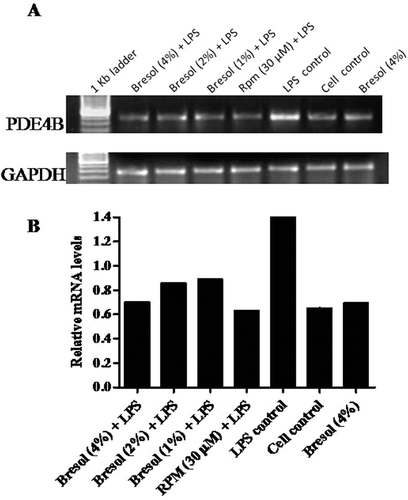
Figure 2.  Effect of bresol on phosphodiesterase 4B (PDE4B) gene expression in U937 cells. (A) Cells were treated with 0.1 µg LPS/ml alone, bresol (4%) alone, 0.1 µg LPS/ml + bresol (at indicated concentrations), rolipram (30 µM) + 0.1 µg LPS/ml, or vehicle only for 24 h. RNA was then isolated from the cultures and RT-PCR carried out using oligo-dT primers and PDE4B-specific primers as described in the Methods. The image shown is a representative from among three replicates. Expression of the housekeeping GAPDH gene is included here to demonstrate loading equality. (B) Densitometric analysis of gene transcripts. The relative level of PDE4B gene expression is normalized to GAPDH. Values shown depict arbitrary units.

Table 2.  Antiinflammatory activity of bresol in U937 cells.

Figure 3.  Effect of bresol on cyclic AMP levels in U937 cells. U937 cells were incubated with bresol at varying concentrations, 30 µM rolipram, or vehicle for 24 h. cAMP levels in the cells were then measured using an ELISA kit. Results are represented as percentage change relative to control cell production values. Data presented are the mean (±SE) from three samples assayed in duplicate. *p < 0.01 as compared to cell control value depicted.
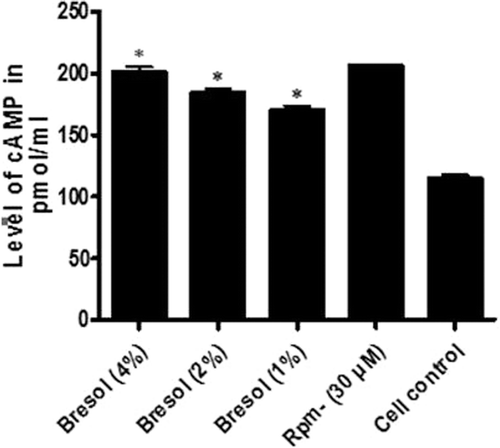
Figure 3.  Effect of bresol on cyclic AMP levels in U937 cells. U937 cells were incubated with bresol at varying concentrations, 30 µM rolipram, or vehicle for 24 h. cAMP levels in the cells were then measured using an ELISA kit. Results are represented as percentage change relative to control cell production values. Data presented are the mean (±SE) from three samples assayed in duplicate. *p < 0.01 as compared to cell control value depicted.

Figure 4.  Bresol-induced TNFα inhibition in human monocytes. U937 cells were incubated with 1 µg LPS/ml alone, bresol (4%) alone, 1 µg LPS/ml + bresol (at indicated concentrations), DXM (100 µM) + 0.1 µg LPS/ml, or vehicle only in media containing 2% FBS for 4 h at 37°C. Conditioned media was then recovered and analyzed for TNFα content via L929 bioassay and quantitative estimation using a human TNFα ELISA kit. RNA from the cells was extracted for RT-PCR. (A) TNFα results. Data are presented as % inhibition (mean ± SE) of LPS-induced TNFα formation over the control (LPS-treated) cells. *p < 0.01 as compared to LPS-only-treated cells. (B) Soluble TNFα secretion from U937 cells. Data are are presented as pg TNFα/ml in culture supernatant (mean ± SE) from three samples assayed in duplicate. *p < 0.01 as compared to LPS-only-treated cells. (C) RT-PCR profile of TNFα. The image shown is a representative from among three replicates. Expression of the housekeeping GAPDH gene is included here to demonstrate loading equality. (D) Densitometric analysis of gene transcripts. The relative level of TNFα gene expression is normalized to GAPDH. The values shown depict arbitrary units.
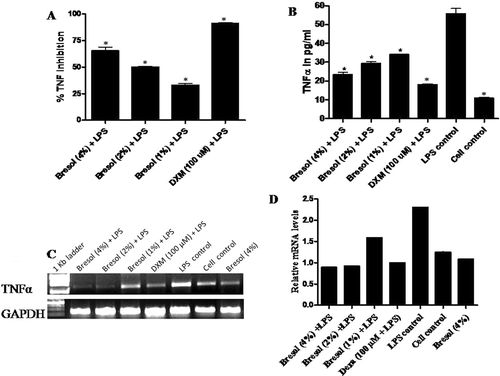
Figure 4.  Bresol-induced TNFα inhibition in human monocytes. U937 cells were incubated with 1 µg LPS/ml alone, bresol (4%) alone, 1 µg LPS/ml + bresol (at indicated concentrations), DXM (100 µM) + 0.1 µg LPS/ml, or vehicle only in media containing 2% FBS for 4 h at 37°C. Conditioned media was then recovered and analyzed for TNFα content via L929 bioassay and quantitative estimation using a human TNFα ELISA kit. RNA from the cells was extracted for RT-PCR. (A) TNFα results. Data are presented as % inhibition (mean ± SE) of LPS-induced TNFα formation over the control (LPS-treated) cells. *p < 0.01 as compared to LPS-only-treated cells. (B) Soluble TNFα secretion from U937 cells. Data are are presented as pg TNFα/ml in culture supernatant (mean ± SE) from three samples assayed in duplicate. *p < 0.01 as compared to LPS-only-treated cells. (C) RT-PCR profile of TNFα. The image shown is a representative from among three replicates. Expression of the housekeeping GAPDH gene is included here to demonstrate loading equality. (D) Densitometric analysis of gene transcripts. The relative level of TNFα gene expression is normalized to GAPDH. The values shown depict arbitrary units.

Figure 5.  Effect of bresol on nitrite production from monocytes. U937 cells were incubated with 1 µg LPS/ml alone, bresol (4%) alone, 1 µg LPS/ml + bresol (at indicated concentrations), DXM (100 µM) + 0.1 µg LPS/ml, or vehicle only for 24 h at 37°C. Conditioned media was then collected for measures of nitrite (via Griess reaction) and the cells were used for extraction of RNA and subsequent RT-PCR. (A) Nitrite in media; µM nitrite calculated by extrapolation from a standard curve generated in parallel with known concentration of sodium nitrite solutions. Data are presented as mean (± SE) of three experiments each done in duplicate. *p < 0.05 as compared to LPS only treated cells (control). (B) Inducible nitric oxide synthase (iNOS) mRNA gene expression. The image shown is a representative from among three replicates. Expression of the housekeeping GAPDH gene is included here to demonstrate loading equality. (C) Densitometric analysis of gene transcripts. The relative level of iNOS gene expression is normalized to GAPDH. The values shown depict arbitrary units.
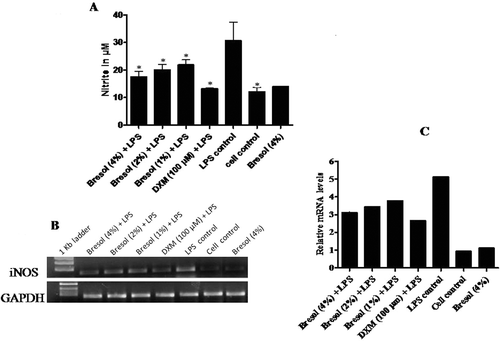
Figure 5.  Effect of bresol on nitrite production from monocytes. U937 cells were incubated with 1 µg LPS/ml alone, bresol (4%) alone, 1 µg LPS/ml + bresol (at indicated concentrations), DXM (100 µM) + 0.1 µg LPS/ml, or vehicle only for 24 h at 37°C. Conditioned media was then collected for measures of nitrite (via Griess reaction) and the cells were used for extraction of RNA and subsequent RT-PCR. (A) Nitrite in media; µM nitrite calculated by extrapolation from a standard curve generated in parallel with known concentration of sodium nitrite solutions. Data are presented as mean (± SE) of three experiments each done in duplicate. *p < 0.05 as compared to LPS only treated cells (control). (B) Inducible nitric oxide synthase (iNOS) mRNA gene expression. The image shown is a representative from among three replicates. Expression of the housekeeping GAPDH gene is included here to demonstrate loading equality. (C) Densitometric analysis of gene transcripts. The relative level of iNOS gene expression is normalized to GAPDH. The values shown depict arbitrary units.

Figure 6.  Inhibition of cycloxygenase-2 (COX-2) activity due to bresol. COX-2 activity was determined using a direct in vitro assay kit. Results are presented as as % inhibition of COX-2 activity (mean ± SE) as calculated against standard COX-2 enzyme activity (as determined using manufacturer’s instructions). *p < 0.01 as compared to DXM.
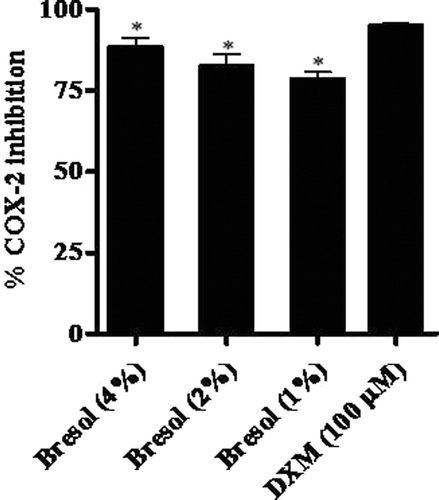
Figure 6.  Inhibition of cycloxygenase-2 (COX-2) activity due to bresol. COX-2 activity was determined using a direct in vitro assay kit. Results are presented as as % inhibition of COX-2 activity (mean ± SE) as calculated against standard COX-2 enzyme activity (as determined using manufacturer’s instructions). *p < 0.01 as compared to DXM.

Reprints and Corporate Permissions

Please note: Selecting permissions does not provide access to the full text of the article, please see our help page How do I view content?

To request a reprint or corporate permissions for this article, please click on the relevant link below:

Academic Permissions

Please note: Selecting permissions does not provide access to the full text of the article, please see our help page How do I view content?

Obtain permissions instantly via Rightslink by clicking on the button below:

If you are unable to obtain permissions via Rightslink, please complete and submit this Permissions form. For more information, please visit our Permissions help page.