Figures & data
Table 1. Toxicity profile of ethanolic extract of A. lanata.
Figure 1. Effect of A. lanata on natural killer cell activity. BALB/c mice were divided into three groups (n = 36/group). Group I animals were induced to form ascites by IP injection of Ehrlich ascites carcinoma cells (EAC, 1 × 10⁶ cells/mouse) and kept as untreated tumor-bearing controls. Group II animals were treated with A. lanata extract (10 mg/kg BW/day, IP) for 5 consecutive days. Group III mice received five daily doses of A. lanata and then EAC cells (1 × 10⁶ cells/animal, IP) 24 h after the final extract treatment. Animals were then sacrificed at different timepoints (n = 3/group/timepoint) thereafter. At necropsy, the spleen was removed and processed to generate single-cell suspensions; these materials were then used as effector cells to determine NK cell activity in a [51Cr]-release assay. Results are expressed as mean (± SD) percentage cell lysis.
![Figure 1. Effect of A. lanata on natural killer cell activity. BALB/c mice were divided into three groups (n = 36/group). Group I animals were induced to form ascites by IP injection of Ehrlich ascites carcinoma cells (EAC, 1 × 10⁶ cells/mouse) and kept as untreated tumor-bearing controls. Group II animals were treated with A. lanata extract (10 mg/kg BW/day, IP) for 5 consecutive days. Group III mice received five daily doses of A. lanata and then EAC cells (1 × 10⁶ cells/animal, IP) 24 h after the final extract treatment. Animals were then sacrificed at different timepoints (n = 3/group/timepoint) thereafter. At necropsy, the spleen was removed and processed to generate single-cell suspensions; these materials were then used as effector cells to determine NK cell activity in a [51Cr]-release assay. Results are expressed as mean (± SD) percentage cell lysis.](/cms/asset/a8637aa3-d90a-4645-a91b-bed401b4def6/iimt_a_609191_f0001_b.gif)
Figure 2. Effect of A. lanata on antibody-dependent cellular cytotoxicity. BALB/c mice were divided into three groups (n = 36 per group) and treated as outlined in the legend to . Mice were then sacrificed at different timepoints (n = 3 per group/timepoint) after tumor induction. At necropsy, the spleen was removed and processed to single-cell suspensions; these materials were then used as effector cells to determine ADCC in a [51Cr]-release assay. Results are expressed as mean (± SD) percentage cell lysis.
![Figure 2. Effect of A. lanata on antibody-dependent cellular cytotoxicity. BALB/c mice were divided into three groups (n = 36 per group) and treated as outlined in the legend to Figure 1. Mice were then sacrificed at different timepoints (n = 3 per group/timepoint) after tumor induction. At necropsy, the spleen was removed and processed to single-cell suspensions; these materials were then used as effector cells to determine ADCC in a [51Cr]-release assay. Results are expressed as mean (± SD) percentage cell lysis.](/cms/asset/4f24f95b-32d0-4ec4-8418-75315c2f068a/iimt_a_609191_f0002_b.gif)
Figure 3. Effect of A. lanata on antibody-dependent complement-mediated cytotoxicity. BALB/c mice were divided into three groups (n = 36 per group) and treated as outlined in the legend to . Mice were then sacrificed at different timepoints (n = 3 per group/timepoint) after tumor induction. At necropsy, blood was collected and serum then separated and incubated at 37°C for 3 h with EAC cells (1 × 10⁶ cells/100 µl) and complement (50 µl, neat). The extent of cytotoxicity was then assessed by a trypan blue exclusion method. Results are expressed as mean (± SD) percentage cell lysis.
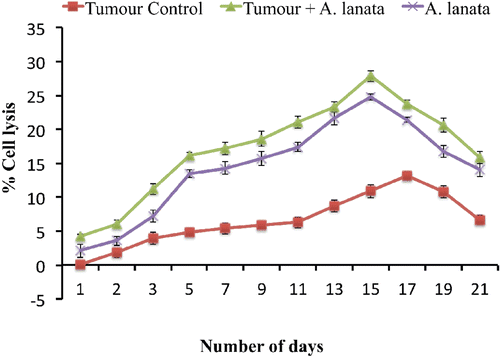
Table 2. Effect of A. lanata on serum cytokine profile.
Table 3. Effect of A. lanata on in vivo CTL generation and survival of animals (System A).
Table 4. Effect of A. lanata on in vitro CTL generation and survival of animals (System B).
Table 5. Effect of A. lanata on in vitro CTL production and survival of animals (System C).
Table 6. Effect of A. lanata on cytokine production during in vivo CTL generation (System A).