Figures & data
Figure 1. Ink mixtures used in analysis.
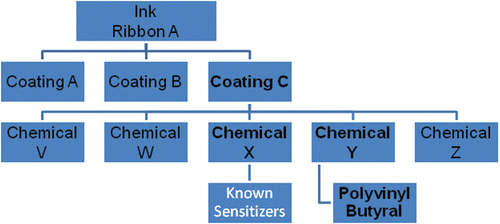
Table 1. Llna phenotypic, and ige analysis after exposure to coating C.
Figure 2 Ear swelling as a result of ink coating treatment. Analysis of irritation after topical application of (A) Coating A, (B) Coating B, and (C) Coating C. Bars represent means (± SE) of five mice (i.e., 10 ears)/group. Levels of statistical significance denoted as ** p ≤ 0.01 compared to acetone vehicle.
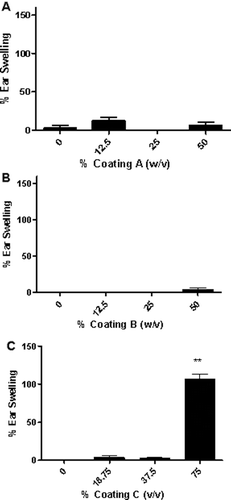
Figure 3. Sensitization potential following dermal treatment with ink coatings. Analysis of the sensitization potential of (A) Coating A, (B) Coating B, and (C) Coating C using the LLNA. [3H]-thymidine incorporation into draining lymph node cells of BALB/c mice following exposure to vehicle or concentrations of ink mixture shown above. Numbers appearing above bars represent stimulation indices for each concentration tested. Bars represent means (± SE) of five mice/group. Levels of statistical significance denoted as * p ≤ 0.05 compared to acetone vehicle.
![Figure 3. Sensitization potential following dermal treatment with ink coatings. Analysis of the sensitization potential of (A) Coating A, (B) Coating B, and (C) Coating C using the LLNA. [3H]-thymidine incorporation into draining lymph node cells of BALB/c mice following exposure to vehicle or concentrations of ink mixture shown above. Numbers appearing above bars represent stimulation indices for each concentration tested. Bars represent means (± SE) of five mice/group. Levels of statistical significance denoted as * p ≤ 0.05 compared to acetone vehicle.](/cms/asset/d68415ef-94fc-4a2c-b713-5a7d19c44b7b/iimt_a_654364_f0003_b.gif)
Figure 4. Sensitization potential following dermal treatment with Chemical Y. Analysis of the sensitization potential of Chemical Y using the LLNA. [3H]-thymidine incorporation into draining lymph node cells of BALB/c mice following exposure to vehicle or concentrations of Chemical Y shown above. Numbers appearing above bars represent stimulation indices for each concentration tested. Bars represent means (± SE) of five mice per group. Levels of statistical significance denoted as * p ≤ 0.05 compared to acetone vehicle.
![Figure 4. Sensitization potential following dermal treatment with Chemical Y. Analysis of the sensitization potential of Chemical Y using the LLNA. [3H]-thymidine incorporation into draining lymph node cells of BALB/c mice following exposure to vehicle or concentrations of Chemical Y shown above. Numbers appearing above bars represent stimulation indices for each concentration tested. Bars represent means (± SE) of five mice per group. Levels of statistical significance denoted as * p ≤ 0.05 compared to acetone vehicle.](/cms/asset/7fa12128-423b-408c-a034-cd57759eb6ac/iimt_a_654364_f0004_b.gif)
Figure 5. Sensitization potential following dermal treatment with polyvinyl butyral. Analysis of the sensitization potential of polyvinyl butyral using the LLNA. [3H]-Thymidine incorporation into draining lymph node cells of BALB/c mice following exposure to vehicle or polyvinyl butyral. Numbers appearing above bars represent stimulation indices for each concentration tested. Bars represent means (± SE) of five mice/group. Levels of statistical significance denoted as * p ≤ 0.05 compared to acetone vehicle.
![Figure 5. Sensitization potential following dermal treatment with polyvinyl butyral. Analysis of the sensitization potential of polyvinyl butyral using the LLNA. [3H]-Thymidine incorporation into draining lymph node cells of BALB/c mice following exposure to vehicle or polyvinyl butyral. Numbers appearing above bars represent stimulation indices for each concentration tested. Bars represent means (± SE) of five mice/group. Levels of statistical significance denoted as * p ≤ 0.05 compared to acetone vehicle.](/cms/asset/e35f237a-834c-418e-a268-cbd6da83b461/iimt_a_654364_f0005_b.gif)