858
Views
8
CrossRef citations to date
0
Altmetric
Research Article

Effects of pioglitazone and/or simvastatin on circulating TNFα and adiponectin levels in insulin resistance

Pages 201-209 | Received 13 Dec 2011, Accepted 23 Jan 2012, Published online: 20 Mar 2012

Figures & data

Table 1.  Time-dependent changes in body weight, glucose, insulin, and TG and TC in rats during 8 weeks of normal (NC) and high fructose diets (HFD).

Table 2.  Effect of 14-day oral PIO (10 mg/kg) and/or SIM (20 mg/kg) on serum glucose, insulin, HIRI, HbA1c, free fatty acid (FFA), and ALT.

Figure 1.  (a) Glucose tolerance curve of normal and insulin resistant rats after initial 8 weeks on the HFD alone and then 14 days on the indicated treatment drug (in conjunction with maintenance of HFD). (b) Changes in the area under the curve (AUC) as derived from the glucose tolerance test for normal control, non-drug-treated HFD, and drug-treated HFD rats. Values shown are mean ± SD (n = 10 rats/group).*,# Value significantly different compared with normal control and HFD control, respectively, at p < 0.05.*,# a,b Value significantly different compared with PIO or SIM group, respectively, at p< 0.05.a,b Values shown are mean ± SD (n = 10 rats per each group).
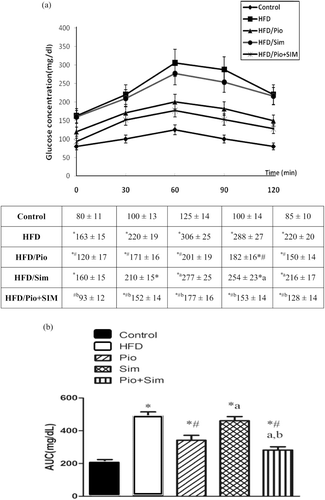
Figure 1.  (a) Glucose tolerance curve of normal and insulin resistant rats after initial 8 weeks on the HFD alone and then 14 days on the indicated treatment drug (in conjunction with maintenance of HFD). (b) Changes in the area under the curve (AUC) as derived from the glucose tolerance test for normal control, non-drug-treated HFD, and drug-treated HFD rats. Values shown are mean ± SD (n = 10 rats/group).*,# Value significantly different compared with normal control and HFD control, respectively, at p < 0.05.*,# a,b Value significantly different compared with PIO or SIM group, respectively, at p< 0.05.a,b Values shown are mean ± SD (n = 10 rats per each group).

Figure 2.  Effect of 14-day oral PIO (10 mg/kg) and/or SIM (20 mg/kg) on serum triglyceride (TG), total cholesterol (T-Chol), LDL (LDL-C), and HDL. All rats were provided normal chow or HFD for 8 weeks prior to 14 days on the indicated treatment drug (in conjunction with maintenance of HFD). Values shown are mean ± SD (n = 10 rats/group).*,# Value significantly different compared with normal control and HFD, respectively, at p < 0.05.a,bValue significantly different compared with PIO or SIM group, respectively, at p< 0.05.
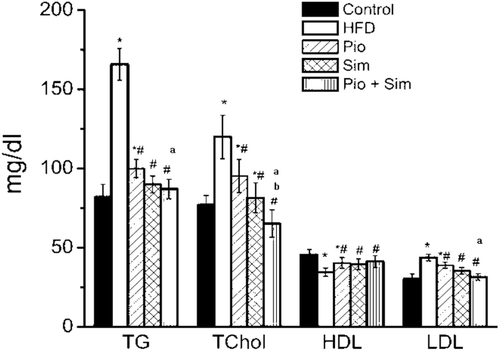
Figure 2.  Effect of 14-day oral PIO (10 mg/kg) and/or SIM (20 mg/kg) on serum triglyceride (TG), total cholesterol (T-Chol), LDL (LDL-C), and HDL. All rats were provided normal chow or HFD for 8 weeks prior to 14 days on the indicated treatment drug (in conjunction with maintenance of HFD). Values shown are mean ± SD (n = 10 rats/group).*,# Value significantly different compared with normal control and HFD, respectively, at p < 0.05.a,bValue significantly different compared with PIO or SIM group, respectively, at p< 0.05.

Table 3.  Effect of 14-day oral PIO (10 mg/kg) and/or SIM (20 mg/kg) on hepatic TG content and of epididymal fat:, visceral fat:, and liver weight:BW ratios.

Figure 3.  Effect of 14-day oral PIO (10 mg/kg) and/or SIM (20 mg/kg) on serum TNFα. All rats were provided normal chow or HFD for 8 weeks prior to 14 days on the indicated treatment drug (in conjunction with maintenance of HFD). Values shown are mean ± SD (n = 10 rats/group). Value significantly different compared with normal control and HFD, respectively, at p < 0.05. *,# a, bValue significantly different compared with PIO or SIM group, respectively, at p < 0.05.
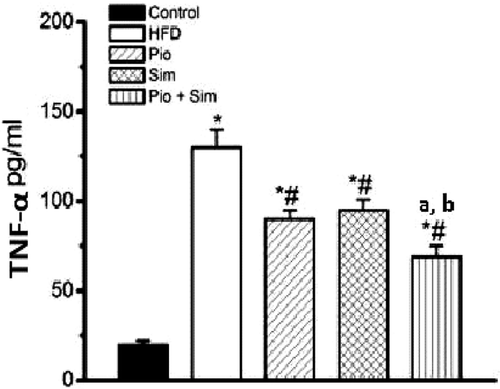
Figure 3.  Effect of 14-day oral PIO (10 mg/kg) and/or SIM (20 mg/kg) on serum TNFα. All rats were provided normal chow or HFD for 8 weeks prior to 14 days on the indicated treatment drug (in conjunction with maintenance of HFD). Values shown are mean ± SD (n = 10 rats/group). Value significantly different compared with normal control and HFD, respectively, at p < 0.05. *,# a, bValue significantly different compared with PIO or SIM group, respectively, at p < 0.05.

Figure 4.  Effect of oral PIO (10 mg/kg) and/or SIM (20 mg/kg) on serum Adp. All rats were provided normal chow or HFD for 8 weeks prior to 14 days on the indicated treatment drug (in conjunction with maintenance of HFD). Values shown are mean ± SD (n = 10 rats/group). *,# Value significantly different compared with normal control and HFD, respectively, at p < 0.05. Value significantly different compared with PIO or SIM group, respectively, at p < 0.05.a, b Value significantly different compared with PIO or SIM group, respectively, at p < 0.05.
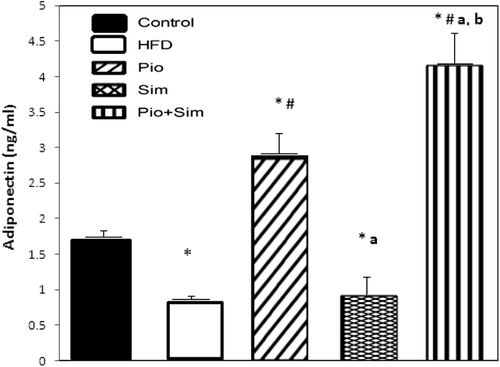
Figure 4.  Effect of oral PIO (10 mg/kg) and/or SIM (20 mg/kg) on serum Adp. All rats were provided normal chow or HFD for 8 weeks prior to 14 days on the indicated treatment drug (in conjunction with maintenance of HFD). Values shown are mean ± SD (n = 10 rats/group). *,# Value significantly different compared with normal control and HFD, respectively, at p < 0.05. Value significantly different compared with PIO or SIM group, respectively, at p < 0.05.a, b Value significantly different compared with PIO or SIM group, respectively, at p < 0.05.

Table 4.  Correlation coefficient (r) for TNFα and Adp (as well as HIRI) with FFA, HIRI, hepatic TG, and visceral fat.

Reprints and Corporate Permissions

Please note: Selecting permissions does not provide access to the full text of the article, please see our help page How do I view content?

To request a reprint or corporate permissions for this article, please click on the relevant link below:

Academic Permissions

Please note: Selecting permissions does not provide access to the full text of the article, please see our help page How do I view content?

Obtain permissions instantly via Rightslink by clicking on the button below:

If you are unable to obtain permissions via Rightslink, please complete and submit this Permissions form. For more information, please visit our Permissions help page.